What is Zelos?
The problem
Your system works as one: firmware, controllers, sensors and equipment. A single event can touch all of them. A firmware change, a test step or a hardware fault can show up across sensors, controllers and equipment at the same time.
Each tool you use captures one piece of that. Telemetry, device logs, recorded runs, test results and your team's notes live in separate tools and formats. Before you can investigate, you export, convert, align timestamps, write scripts and share the result.
What Zelos is
Zelos puts all of that data in one place, so you can observe, control, test and analyze your system, live or recorded. Every source arrives as signals in one app, on one timeline.
How it works
Zelos has two parts:
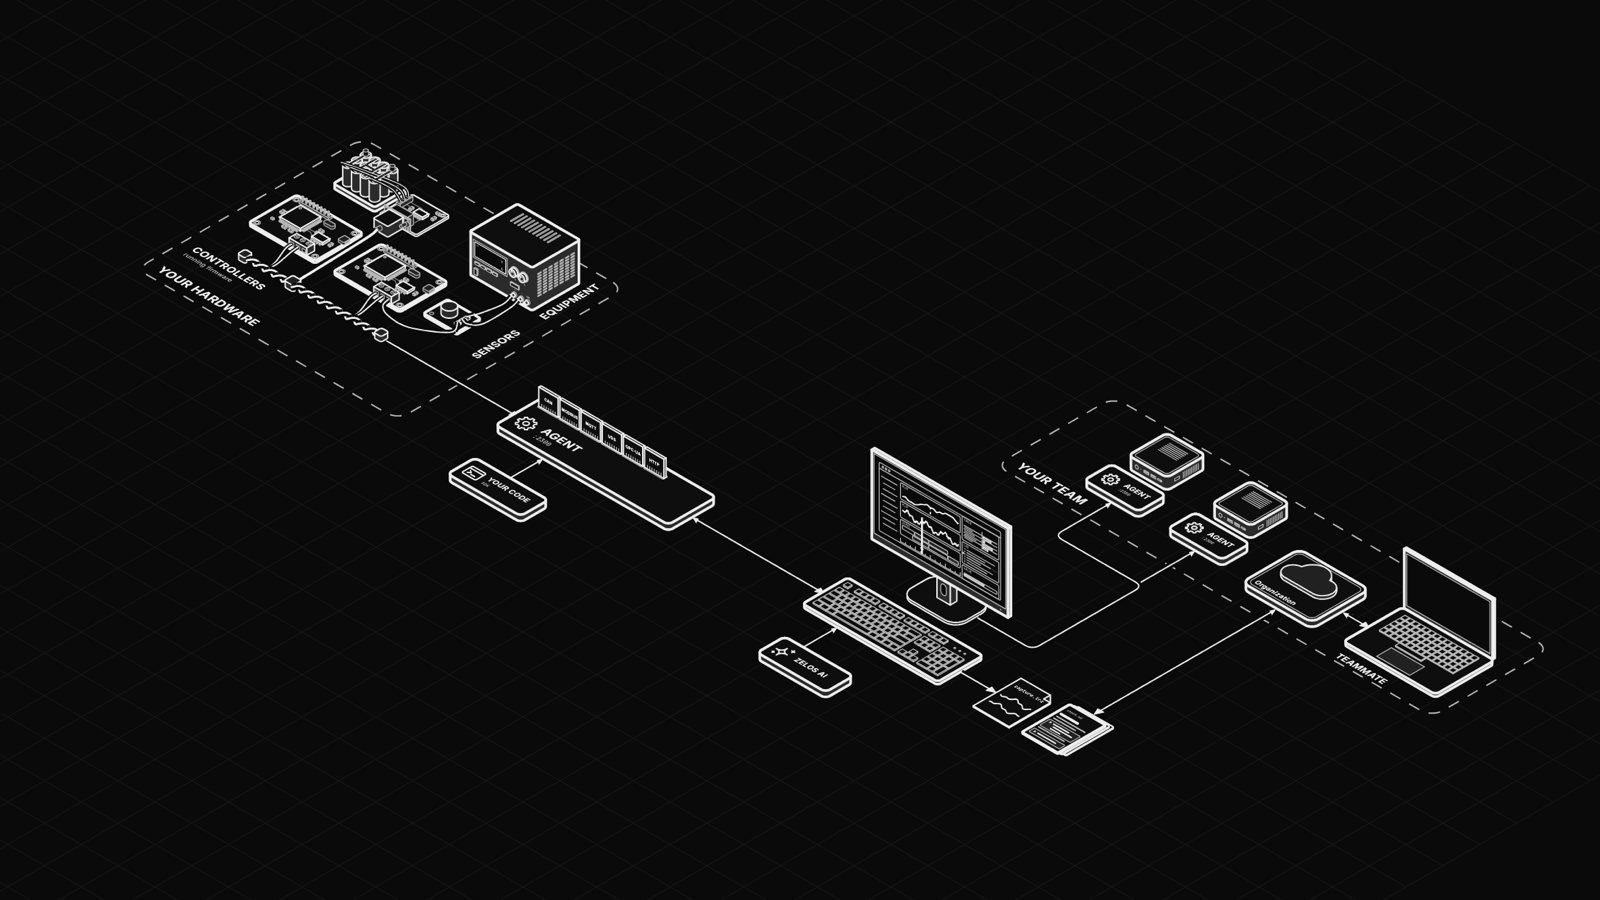
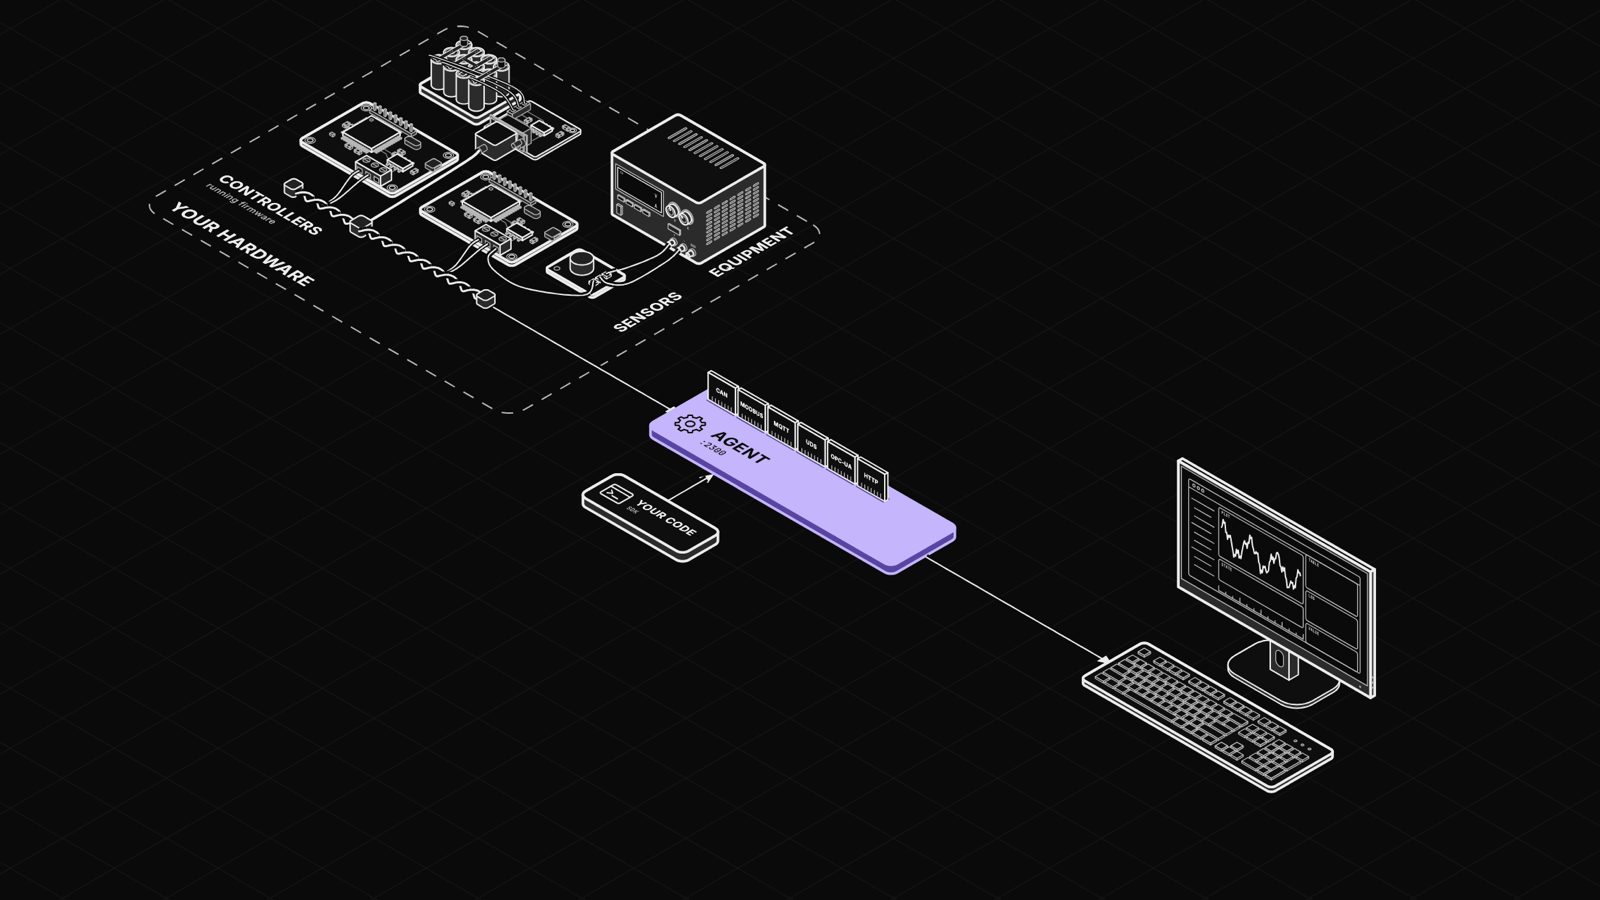
- The Zelos agent collects data from your hardware.
- The Zelos app is where you see that data and work with it.
The desktop app includes its own agent, which starts when the app opens. For a bench machine, test rig or edge device without a screen, install the agent on that machine and connect the app to it over the network.
Collect
Extensions connect the agent to whatever protocols your hardware speaks. Install them from the Extensions view in the app, configure them, and their data streams in. If your hardware needs something the marketplace does not have, build your own extension.
Your own code can send data too. The SDK streams data from Python, Rust or Go programs: test scripts, simulators, firmware tools or services.
Whatever sends it, data arrives as signals: named, timestamped values, grouped by the source that sent them. See Core Concepts for the data model.
Observe
In the app, you lay your data out in panels: plots, tables, logs, values and state timelines. Every panel in a workspace shares one timeline and one cursor, so you see every signal at the same moment, live or played back.
Save what you captured as a trace, a .trz file, to replay it later, compare runs side by side or share it. Save the arrangement of panels as a layout to reuse it on the next run.
Control
Zelos works both ways. Extensions and your own code can expose actions: commands such as sending a CAN frame or writing a register. Run them from the Action panel, and the command goes back through the agent to your hardware, beside the data it affects.
Test
A notebook is one Markdown file that mixes notes and Python code. Use one to analyze your data. Add checks and assert on their results, and it becomes a test: zelos notebook run exits with code 1 when an assertion fails, so the same notebook gates a release in CI.
For test suites written in Python, the SDK's pytest plugin checks signals over time and can record each test run as a trace.
Analyze
Zelos AI helps you investigate. Ask what happened, and it searches your signals, finds the moment, builds the panels and layouts that show it, and writes up what it finds in a notebook. Before an action that can reach your hardware, changes an extension or deletes panels, it asks you to confirm. See Confirmations and safety.
Share
Your team shares traces, layouts and notebooks through Zelos Cloud, inside your organization. The app also connects to agents on other machines, so the whole team can watch the same bench.
Next steps
-
Install the app
Zelos runs on macOS, Windows and Linux.
-
Take the guided tour
See the whole app on a simulated site, no hardware needed.
-
Learn the concepts
Agents, signals, traces, layouts and where your data lives.