Guided tour
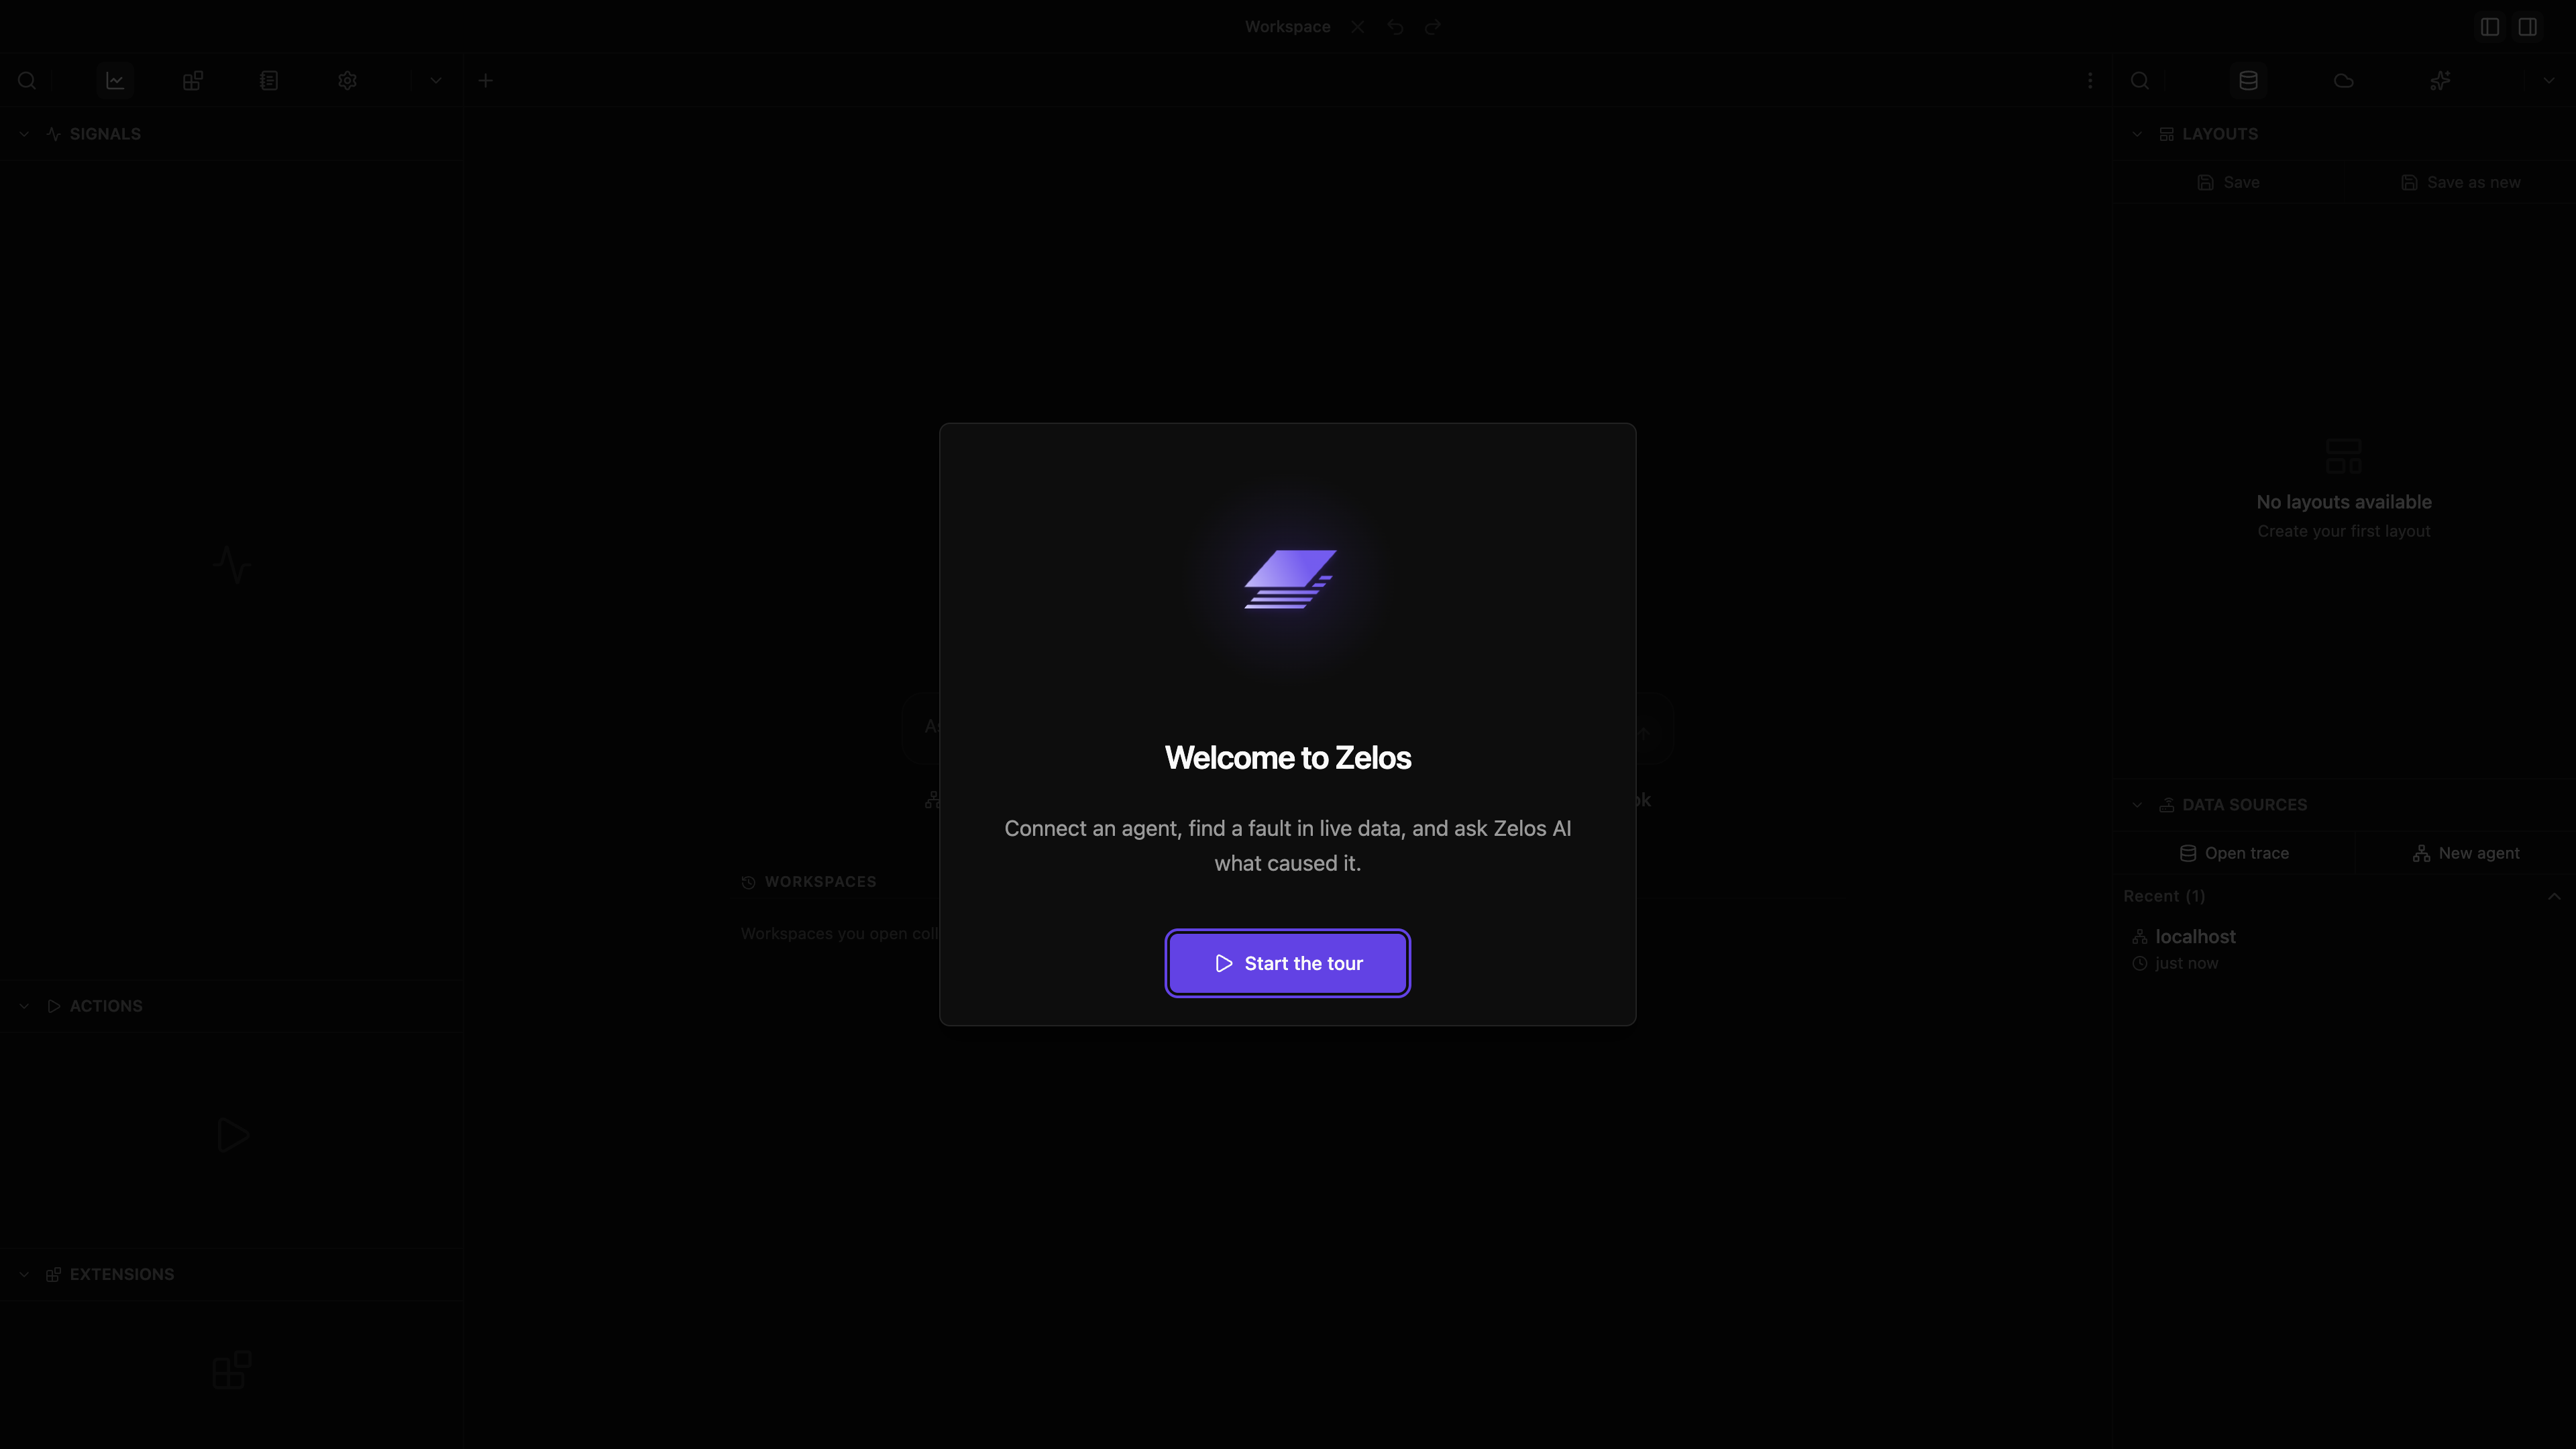
The first time you sign in to the desktop app, it welcomes you with the tour, right after you create or join your organization. You can take it again at any time from the command palette (Start the guided tour) or from Settings › App › Guided tour.
It is eight steps. A simulated battery site comes online and misses a dispatch target. You work out why, then ask Zelos AI, and it reaches the same answer and writes it up as a notebook, where the tour ends. Everything you do is the real app. The Marketplace, the panels, the timeline and the AI view are all real.
What is behind them is not. For the length of the tour the app talks to a simulated site instead of to your agent and your account: the bus, the extension and the assistant's reply are all made up on this machine. Nothing is written to disk, nothing reaches your agent, and nothing leaves for the cloud. Exit tour on any card leaves it, and leaving removes all of it. So does quitting or reloading mid-tour: the next launch puts your sidebars and lists back the way it found them, and because the tour never ended, its welcome screen comes back. If the tour itself runs into a problem, it ends, says so, and puts everything back; you can start it again from Settings.
The story
A grid-connected battery site is asked for a fast ramp to 248 kW and delivers 206. Its battery management system (BMS) reports a comms fault and cuts the pack's power limit.
The pack is fine. What actually happened is that the DC bus sagged under the ramp. The heartbeat between the power conversion system and the BMS missed three frames 300 ms later. The BMS read that silence as a pack fault. The evidence that clears the battery is on a different bus from the component that got blamed. Finding it means having every source on one timeline.
The eight steps
Explorer, the extension's page, the AI view and the write-up are opened for you. The tour asks you for the actions worth learning, and for one click on the rail, so you have opened a view yourself. The steps come in three chapters: connect, investigate, answer.
| Step | What you do | What it shows you |
|---|---|---|
| 1 | Connect the localhost agent |
The Data view lists agents, which read your hardware, and recorded traces, which open here too. The app bundles an agent; remote agents connect the same way. Then Explorer, which lists what an agent has, and is empty |
| 2 | Open the Extensions view from the rail | The rail icons switch between views. An extension connects an agent to an interface: CAN, Modbus, OPC UA, serial |
| 3 | Install CAN Bench from its page | A battery site simulated on a CAN bus: a pack and its BMS, a DC/DC converter, an inverter, and a site controller |
| 4 | Open its settings, pick a channel and a bitrate, then Save & start | Settings tell an extension what to read. Both reach the data |
| 5 | Command a dispatch | Actions drive hardware from Zelos and come back with a result. Here that is a time range, and the timeline pauses on it. The site delivers less than you asked for |
| 6 | Open the sidebar search and drag input_voltage onto the plot |
Every signal the agent knows is in the tree. The tour writes the search term; you build the panel by dragging |
| 7 | Turn on the ruler | Two cursors on the sag, and each legend chip shows that signal's change between them: the bus fell before the BMS cut the limit |
| 8 | Send the prefilled question | Zelos AI has its own view. It reads the same signals you did, checks the pack, builds a layout of the fault, and writes the finding up as a notebook. It reaches the same answer you did |

A step moves on when the thing it asked for actually happened, not when something was clicked. The dispatch counts when the site returns a window that holds the failure. The measurement counts when the ruler spans the drop. An instruction card has no way to skip past it. The cards that report what just happened carry Continue, which is you saying you have read them.

While it runs
Only the control the current step asks for responds. Everything else is dimmed and inert. A click there does nothing, on purpose. ++escape++ asks whether you want to leave rather than dropping you out.
Keyboard shortcuts are held back for the same reason, with one exception: quitting the app always works. The close-window shortcut does not, because a window closing under a running tour leaves it pointing at furniture that is gone. The title bar's own close button is not a shortcut and still closes the window; the next launch cleans up after it.
After the answer, Continue opens one last screen, the way the tour began. Done ends the tour.
While it runs, the Data view, the Layouts section and the Cloud view show the tour's own agents, traces and layouts in place of yours, so nothing of yours is on screen or at risk. Leaving removes the site, its workspace and the assistant's write-up. CAN Bench goes with them. It is a prop the tour builds its story out of, not an extension you keep, and it appears in the Marketplace only while a tour is running. Start the tour again from Settings.
What the settings do
The settings dialog has two, and both reach the data.
- Channel is the interface the bus publishes on. It names the source in the site's log and in the assistant's write-up.
- Bitrate is how fast the bus runs, and so how many frames a second arrive. The faster one makes every trace denser. Both are fixed when you press Save & start.
The write-up
The assistant writes one as part of answering, and the tour opens it once you have read the answer. It is a read-only notebook holding the run. It lists what moved and in what order, the pack checks (three of which pass), the cause, and the queries behind all of it. It lives in the tour's own notebook library for as long as the tour does, and there is no file on disk.

The queries it lists are the part worth keeping. Point the same four at your own capture and they answer the same question about it.
Then your own hardware
Real hardware works the same way you just watched, and by the same steps: connect an agent, install its extension, configure it, start it. CAN Bench simulates a site rather than reading one, but it is installed and run exactly like an extension that does.
The agent is the process that owns the connection, collects the data and answers
queries. The tour used the one this app bundles, called localhost, which is why step 1
connects to it. An agent can also run on a bench machine, or on the vehicle itself:
connect that one from the Data view, and install the extension onto it instead. The
rest is what you have already done.
See Installing the agent for getting one running, and Extensions for what is there to install.