State Panel
The State Panel shows a discrete signal, like a gear position or a drive mode, as colored spans over time. Each run of a value is one labelled block that holds until the value changes, so you can see which state the system was in and for how long.
Overview
- One lane per signal, stacked top to bottom.
- One colored block per state: a run of the same value, labelled with that value.
- The time axis is shared with your Plot panels and the timeline, so a state lines up with the plotted values at the same moment.
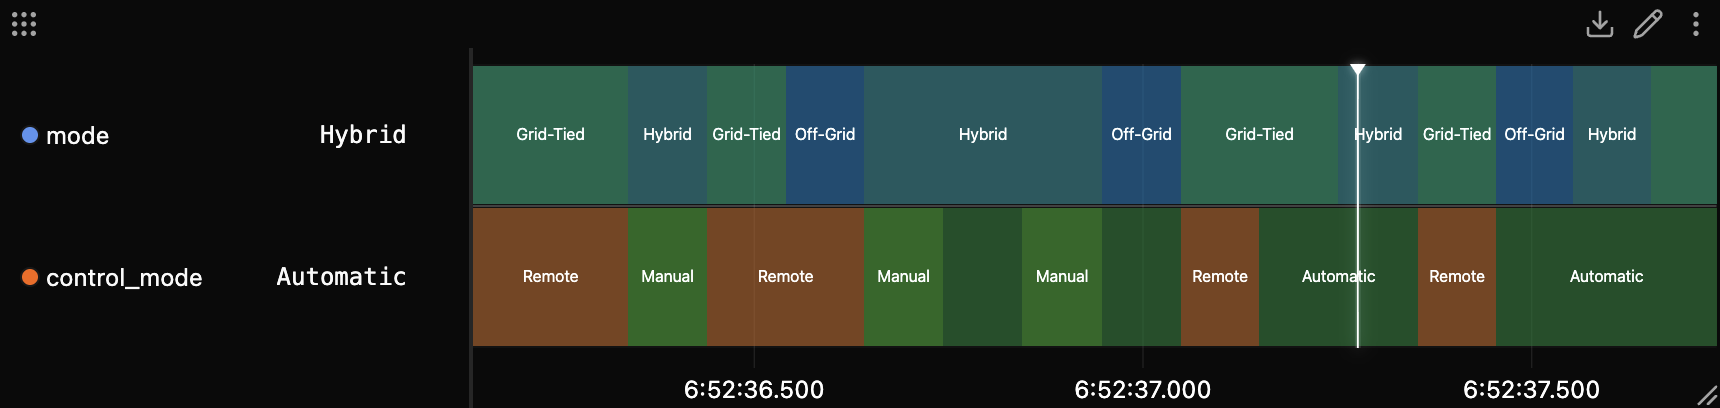
mode and control_mode as two lanes. Each state is a labelled, colored block that holds until it changes; the live edge is on the right.Adding a State Panel
- Add Panel → State in the timeline toolbar, then drag signals into it.
- Drag more signals onto the panel to add lanes.
A State panel is only created when you add it explicitly. Dragging signals into empty space always makes a Plot.
It's best for discrete signals whose value holds, like an enum, a mode, or a boolean, but it draws any signal. Since each block is one held value, the block widths show the timing. Drop in a fast-changing or numeric signal and you can see how often it changes and how long it sits at each value, its cycle times, which a line plot doesn't make obvious.
Lanes
Each signal gets its own lane, in the order the panel lists them.
- Click a signal's legend chip to hide its lane. The lane keeps its place, and clicking again brings it back.
- If a signal stops and later resumes, the break stays a gap. The panel never stretches a state across missing data. When the same signal comes from overlapping recordings, each one gets its own lane.
Colors
The State panel uses two kinds of color, and it helps to keep them straight:
| What | Colored by | So… |
|---|---|---|
| A state block | the state's value | the same state is the same color throughout this panel |
| A legend chip | the signal | it identifies the series, the way a plotted line's color does |
Changing a resolved chip's color re-tags that signal source. It never repaints the state blocks, because those are tied to the values themselves. Right-click a chip with an authored scoped override and choose Reset color to return it to its inherited base or automatic color.
Colors are assigned automatically from a color-blind-safe palette, and the same value stays consistent within a panel. State-color overrides are stored per panel. To set one, open Edit Panel → Data and use State colors to pick a color per value, or reset one to automatic. You can even add a value by name before any data arrives, so a layout's colors can be set up ahead of time.
Reading a state
An enum signal maps each raw code to a name, and the panel shows the name. On the block you see just the name (Drive) so it stays readable. Hover for the full detail:
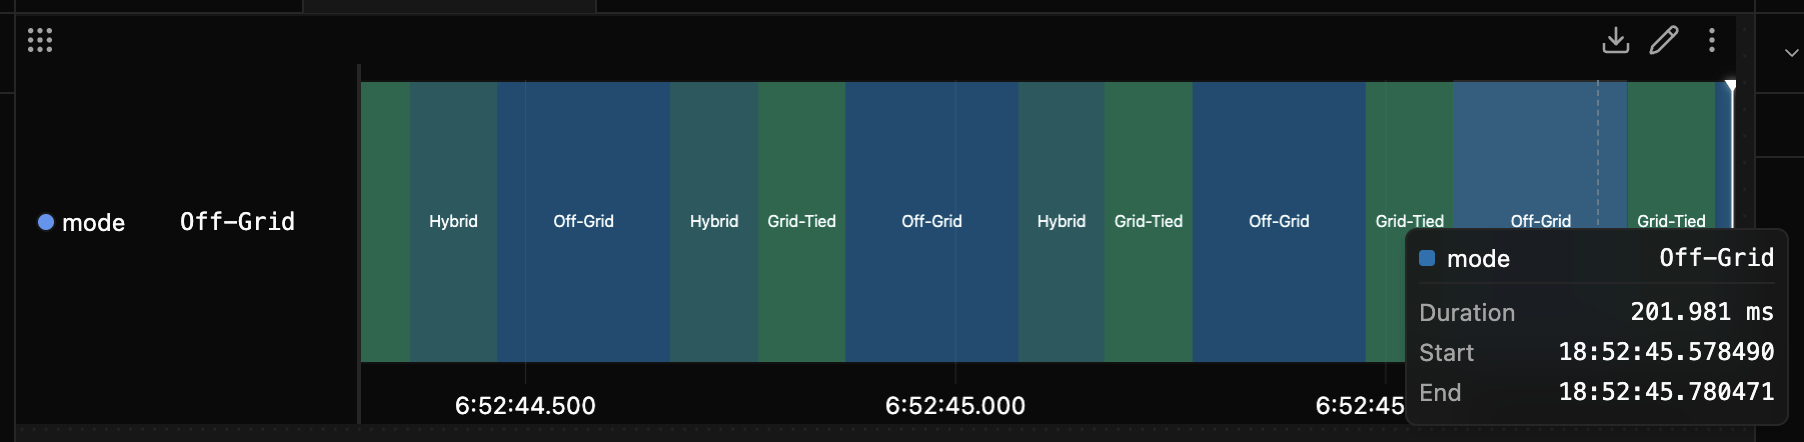
The tooltip shows the name and its value together, like Drive (3), plus the duration and the start and end times. (For a plain text state like the inverter's Grid-Tied, the name is the value, so there's nothing in parentheses.) Right-click the chip and use Display format to change how the value reads: 0x3, 0b11, and so on.
Linked to the rest of your layout
Hovering a state lights up its whole time range. The same shaded band appears on every Plot panel and on the timeline, so you can see what your other signals were doing while that state held.
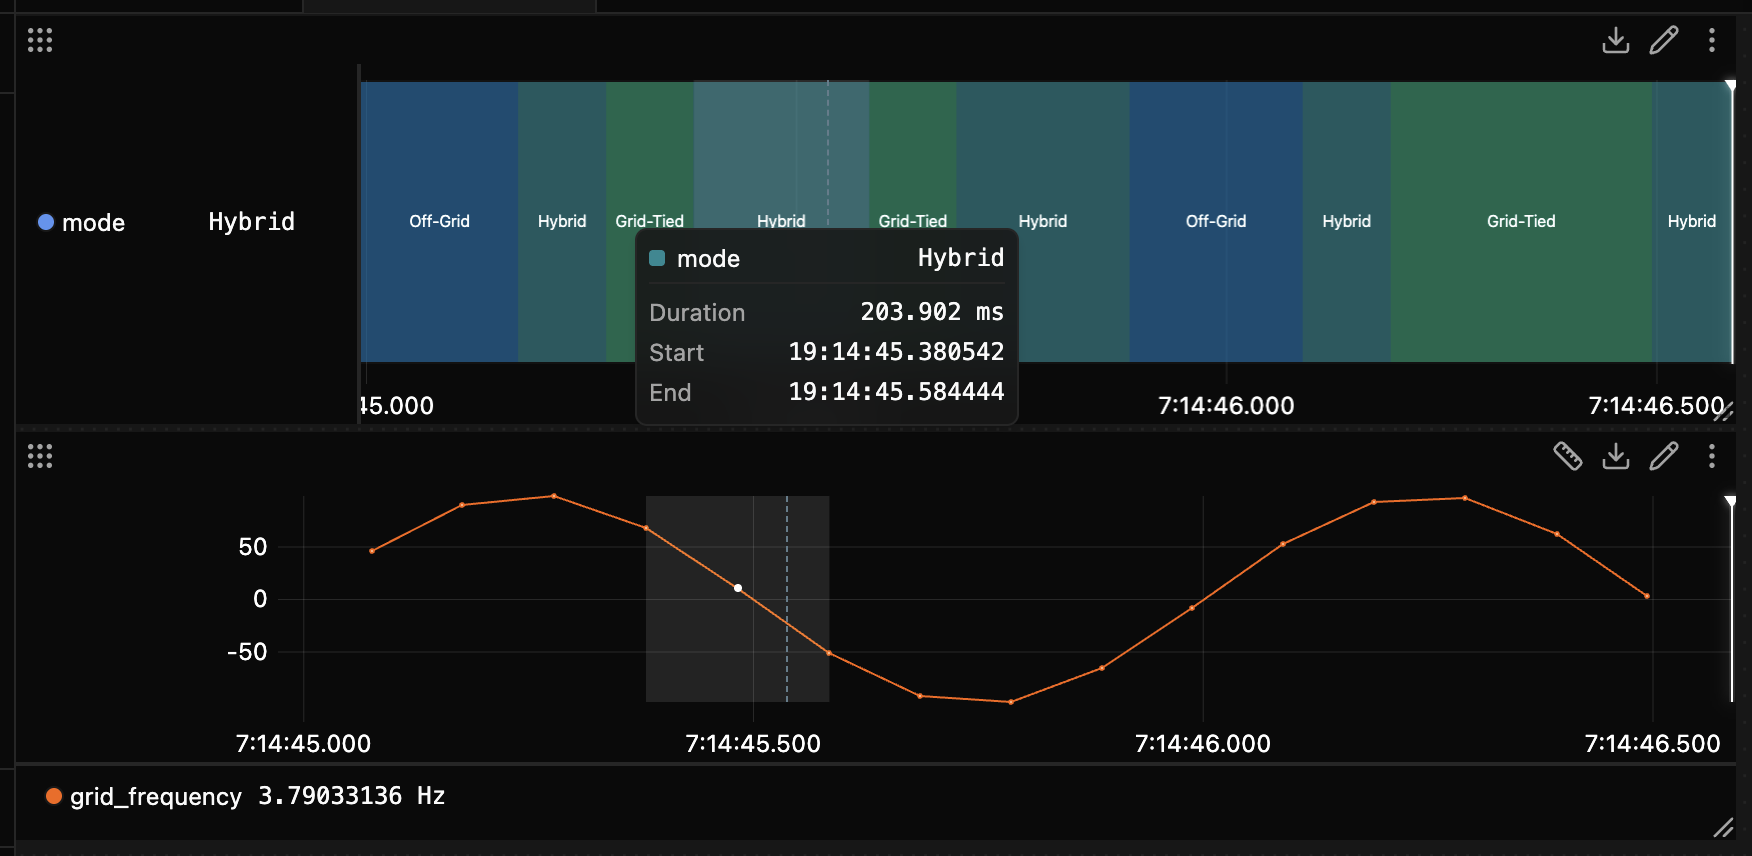
Hybrid state shades its interval on the lane and on the grid-frequency plot beneath it. Both line up on the shared timeline.When states change too fast to see
Sometimes states change faster than a single pixel can show, with several transitions landing in the same sliver of screen. Rather than pick one and pretend it's the state, the panel paints that sliver neutral gray and tells you to look closer:
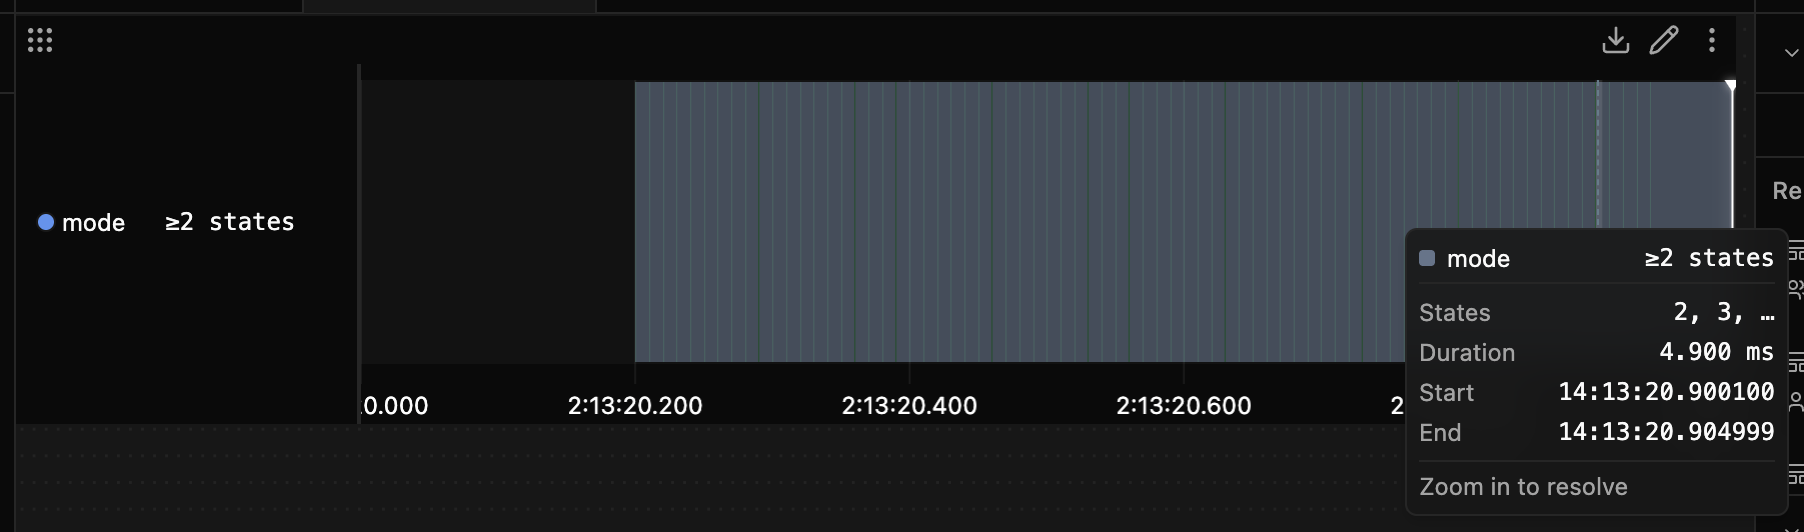
≥2 states. Zoom in to resolve them.- A colored block is one known state.
- A gray block means several states are packed in here. Zoom in and it splits back into the individual colored states as soon as they're wide enough to draw.
So color always means "this is the state", and gray always means "zoom in".
Following live data
While a live workspace is playing, each lane grows to the right as new states arrive and the view scrolls with the timeline. When a signal's stream stops, its lane ends at the last state it reported instead of stretching that state up to the present.
Cursor and keyboard
- Right-click a lane to drop the timeline cursor there. Every other panel jumps to that moment.
- Drag across a lane to zoom into that stretch of time; double-click to step the zoom back.
- With the panel focused, ↑ / ↓ move between lanes and ← / → jump the cursor to the previous or next change on the focused lane.
Context menu
Right-click a legend chip for the same menu the Plot panel uses:
| Item | Effect |
|---|---|
| Reset color | remove an authored scoped chip-color override; inherited and automatic colors do not show this row |
| Display format | show the value as Default, Hex, Binary, Octal, or Scientific |
| Copy value / Copy path | copy the current value, or the signal's path (source/message.signal) |
Use the chip's X button to remove the signal and its lane.
Settings
Edit Panel → Config:
- Legend & labels: show or hide the legend and place it on the left or right; show each lane's current state in its chip while live (Live values); set the Font Size of the on-block labels. A label that no longer fits its block is hidden rather than clipped.
- Axes: Align with stacked plots lines the time axis up with Plot panels above and below; Hide X axis reclaims the time-tick strip.
Per-value State colors live on the Data tab, beside the signal list. Each signal row also provides its definition's base color, base display format, and Any or specific-source coverage. Source-specific chip appearance stays on the resolved chips. Defaults for new State panels are under Settings → Panels → State.
Export Data
Use the panel header's Download button to export as CSV or JSON. See Export panel data. The export is the signal's raw values over the selected time range, not the drawn blocks.