Settings
Click the Settings button in the left sidebar's rail (gear icon, also in the rail's ⌄ menu). The sidebar switches to the settings sections — grouped under collapsible App, Panels, Data, and System headers — and the Settings tab opens. All settings live on one scrollable page: click a section in the sidebar to jump straight to it, and the sidebar highlights the section you're reading as you scroll.
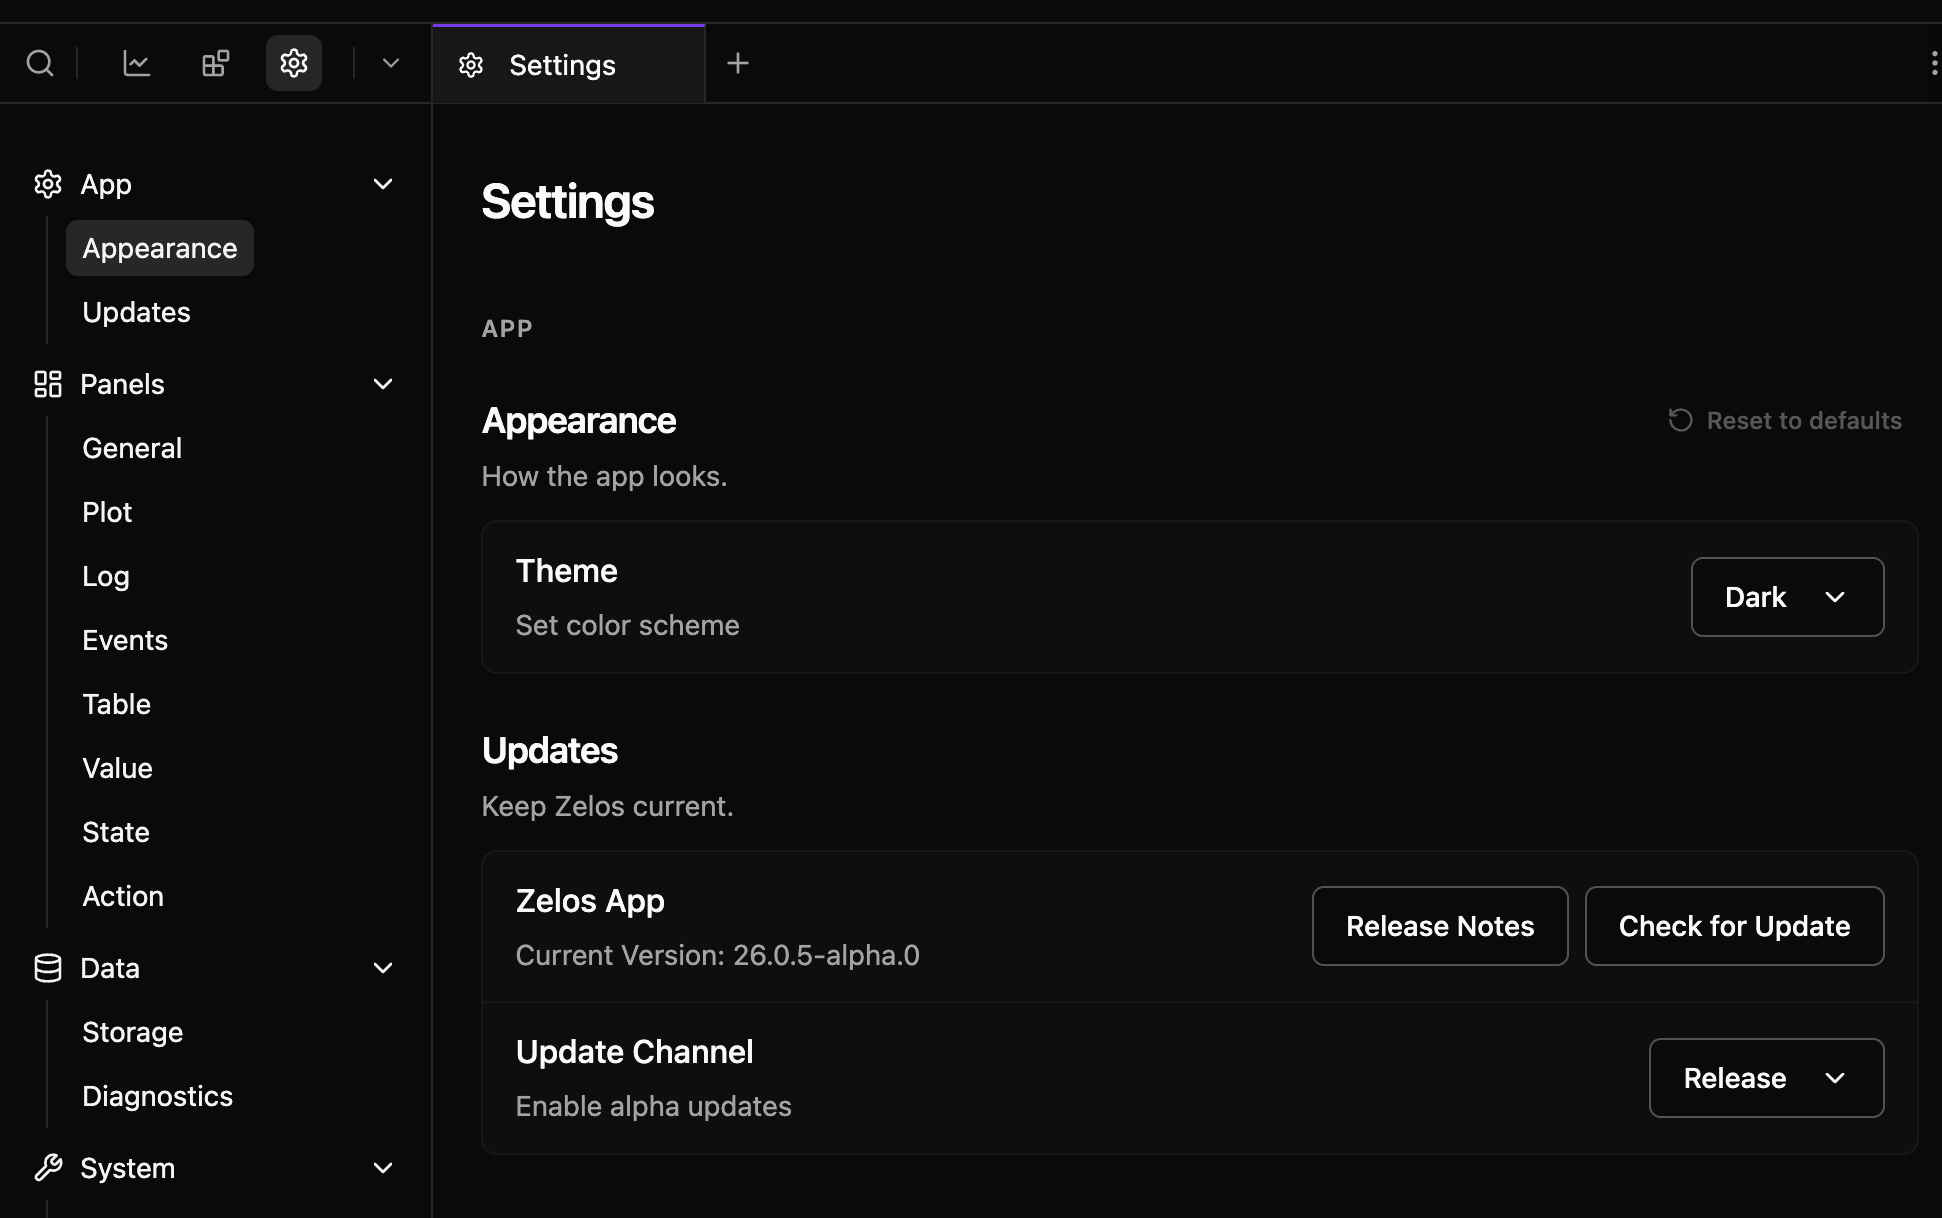
Settings Tab Behavior
Only one Settings tab can be open per workspace. If already open, clicking the Settings button activates the existing tab.
Searching settings
With the Settings view active, use the rail search (Cmd+F / Ctrl+F) to search every setting — names, descriptions, and synonyms all match ("fps" finds Framerate, "telemetry" finds usage analytics). Picking a result scrolls to the exact control and highlights it briefly.
Sections with adjustable defaults show a Reset to defaults next to their title when something in them has been changed.
Team and account
Your team sits at the top of the settings sidebar — if you belong to several, click it to switch, or pick Manage team to open the team in Zelos Cloud. Your account lives at the bottom: click Sign in when you're signed out, and once signed in the row shows your name and email, with a menu offering Billing (opens Zelos Cloud) and Log out. Signing out never deletes local workspaces — your work stays on your computer.
App
Appearance
Theme — control the app's appearance:
- System - Follow your OS light/dark setting
- Light - Always use the light theme
- Dark - Always use the dark theme (default)
Changes apply immediately.
Updates
- Zelos App - Shows the installed version. Check for Update checks immediately (the app also auto-checks every 5 minutes); when an update is available, Update and Restart App installs it in one click. Release Notes shows what changed — a NEW badge appears when updates are available.
- Update Channel - Release (default) for stable releases, or Alpha for pre-release versions.
Panels
Default options applied to newly created panels, one section per panel type. These preferences are stored locally in the app (per installation) and are not synced to the agent or other devices. Changing a default never affects existing panels — each panel keeps the options it was created with, and any option can still be overridden from an individual panel's settings.
- General - Cross-panel signal defaults: Show empty signals (keep signals visible when they have no data in the current view; on by default) and Show full name (show each signal's full path instead of just its name; off by default).
- Plot - Legend visibility and placement, live values, Interpolation (Linear default, Stepped, or Spline), Sample markers and marker size, Line width and pattern, Area fill, axis layout, stacked-plot alignment, and hiding the X/Y axes.
- Log - Which columns are shown (timestamps, levels, producers, sources, file, line), message wrapping, font size, auto-scroll, and buffer size.
- Raw - Font size, auto-scroll, and buffer size.
- Table - Font size.
- Value - Column count and font size.
- State - Legend visibility and placement, live values, label font size, stacked-axis alignment, and the time axis.
- Action - Parameter column count, parameter persistence, and how actions execute (Enter to execute, inline button).
Data
Storage
Data Retention
How long to keep live data before it is pruned:
Options: 1, 2, 4, 8 (default), 12, or 24 hours.
Longer retention uses more resources, but allows viewing older live data without reconnecting. In memory mode this increases RAM usage; in disk mode it can also increase disk usage. This setting applies to both memory and disk stores. Disk mode survives restarts, but data older than the retention window is still pruned.
Store Type
Choose how live data is stored:
- Memory - Fastest option. Live data is kept in memory only and is lost on restart.
- Disk - Stores live data on disk so it survives normal restarts.
- Changing the store type requires restart.
- Disk store is currently in beta.
On a normal shutdown, the disk-backed store flushes remaining buffered data before exit. Force-quitting the app or agent can still lose the newest buffered samples.
Memory Limit
Shown when Store Type is set to Memory on Linux
Maximum memory usage before live data pruning begins:
- Set as percentage of system memory or absolute value (MB/GB/TB)
- Default: 25% of system memory
- Minimum: 100 MB
- Unlimited: Disable the memory cap and rely on time-based retention only
Disk Size Limit
Shown when Store Type is set to Disk
Maximum disk space for live trace data:
- Set in MB, GB, or TB
- Unlimited disables size-based pruning
- When the limit is exceeded, the oldest on-disk data is pruned first
Store Folder
Shown when Store Type is set to Disk
Choose where disk-backed live data is stored:
- Leave empty to use the default app data location
- Changing the folder requires restart
Clear Store Data
Remove all live data from the current store:
- Works for both memory and disk modes
- Cannot be undone
Diagnostics
Logs Folder
- Opens the folder containing application log files
- Logs capture errors, warnings, and diagnostic information
Log Retention
How long to keep log files before they are deleted:
- Selectable from 1 day up to 30 days
- Default: 14 days
Older logs are removed automatically.
Share usage analytics
- Enabled by default
- Helps improve the app by sending anonymous usage data
- Turn it off to stop sharing usage analytics from this installation
System
Advanced
Framerate
UI update frequency for time axis:
- Options: 1, 5, 10, 15, 20, 25, 30, or 60 fps
- Default: 30 fps
- Lower rates reduce CPU usage
Minimum Fetch Interval
Throttles data refresh rate:
- Options: None, 30ms, 60ms, 100ms, 250ms, 500ms, 1000ms
- Default: None
- Prevents rapid re-fetching
Plot Optimization
Data query strategy:
- M4 (default) - Intelligent downsampling for better performance
- None - Full resolution (raw data)
Developer Mode
Unlocks the Developer section below.
Developer
Visible while Developer Mode is on.
- Debug Logs - Saves additional logging during trace capture; helpful for troubleshooting
- Performance Overlay - Shows performance metrics; toggle with
Ctrl+D - Restart Agent - Manually restart the background agent process
Next Steps
-
Sign in and authenticate
-
Save and share layouts
-
Master workspace features