Panels
Panels turn workspace data into plots, tables, logs, state timelines, focused readouts, and controls. Add them from the timeline toolbar, populate them from the Explorer, and arrange them into reusable layouts.
Panel types
| Type | Best for |
|---|---|
| Plot | Signals over time, including measurements and cursor values |
| Log | Structured zelos.log.* events |
| Raw | Raw event records in time order |
| Table | Dense, cursor-aware signal values |
| Value | Large latest or cursor-time readouts |
| State | Discrete state changes as labelled spans |
| Action | Running agent actions and viewing their results |
Action panels are available only in live workspaces. Older layouts can still contain legacy Gauge panels, but Gauge is no longer offered in the picker.
Add and arrange panels
Click Add panel in the timeline toolbar and choose a panel type.
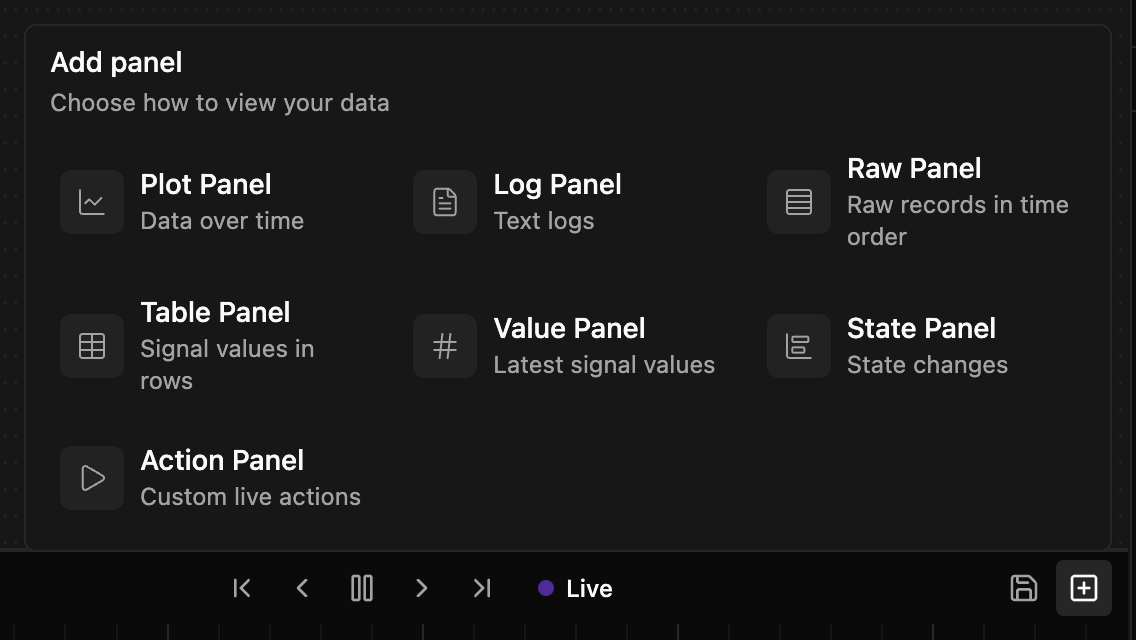
You can also create panels directly from the Explorer:
- Double-clicking a signal creates a Plot at the bottom of the current layout.
- Dropping signals into empty layout space, between rows, or on a panel's top or bottom insertion band creates a Plot.
- Dropping a whole
zelos.log.*event creates a Log panel. - Dropping any other whole event, an event without a recognized type, or a mixed selection creates a Plot. Raw panels are never created automatically; add one from Add panel or drop data onto an existing Raw panel.
- Dropping signals in the center of an existing Plot, Table, Raw, Log, Value, or State panel adds them to that panel. Action panels reject signal drops.
Finding a panel you just created
If a new panel lands below the visible part of the current layout, Zelos scrolls it into view and briefly outlines it. If the creation targets a layout tab that is not currently visible, the reveal runs when you open that tab.
Drag a panel header to reorder it or move it to another tab. Resize the panel from its lower-right handle; while you drag, the panel outline and resize grip highlight so it is clear which panel is changing.
Panel header
Each panel header provides:
- A drag handle and title
- A Download button for export (all panel types except Action)
- An Edit pencil that opens Edit Panel
- A More options menu containing Remove
Descriptions configured in Edit Panel appear from the information icon beside the title.
Edit Panel
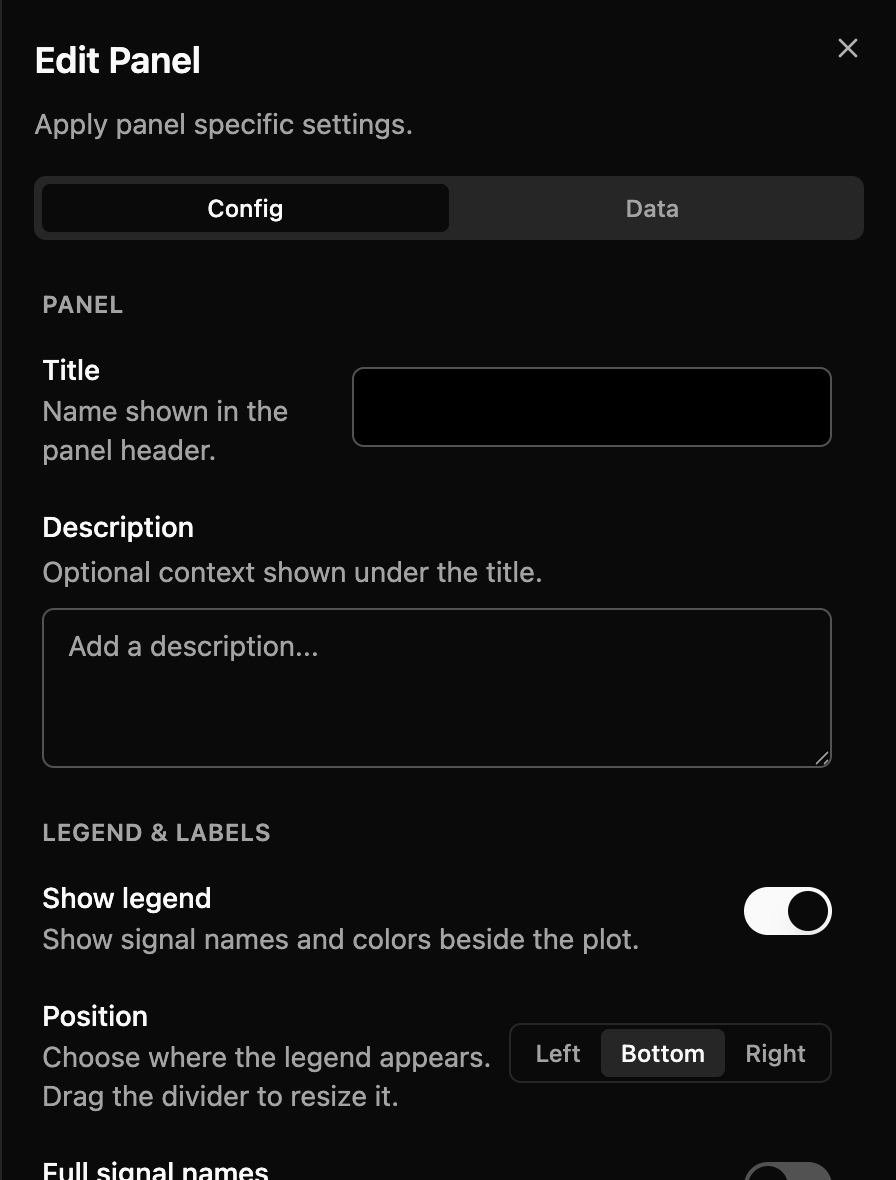
Click the pencil in a panel header to open Edit Panel. The editor has two tabs:
- Config contains the title, description, and controls specific to that panel type.
- Data manages the signals or action bound to the panel.
Data tab
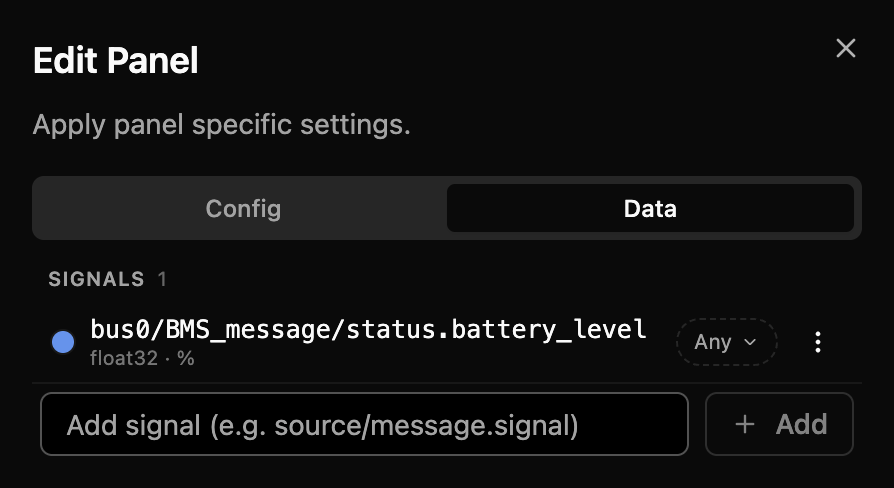
Each signal row represents one logical signal definition and includes:
- A base color
- The signal path, which you can click to edit
- Type, unit, enum, dictionary, availability, and base-format metadata when known
- A compact Any or N sources coverage pill
- A row menu for removal and, on Plot, Table, Value, and State panels, the base display format
The Add signal form stays pinned to the bottom of the Data tab while the configured rows scroll.
Source coverage
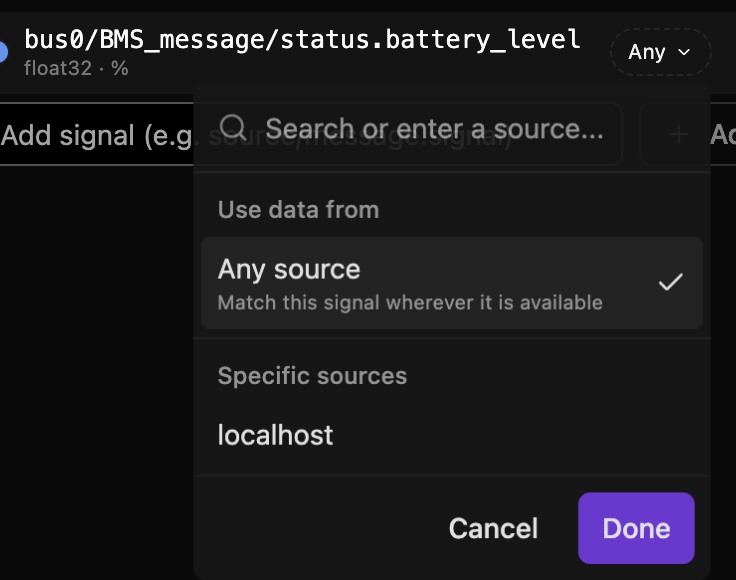
Coverage controls where a signal definition may resolve:
- Any is portable: it matches the signal wherever it is available.
- N sources limits the definition to the selected agents or trace producers.
Open the inline coverage pill to select connected sources or enter a source that is currently offline. Changes are staged until you click Done.
Base and resolved appearance
The Data row stores the definition's base color and, for supported panel kinds, its base display format. A portable definition can resolve into multiple source-specific chips. Color and format changes made from a resolved chip target that resolved source rather than changing the base definition.
Right-click a resolved signal chip to open its context menu. Depending on the available value, it includes Display format, Copy value, and Copy path. Reset color appears only when that exact resolved chip has an authored scoped color override; inherited and automatically assigned colors do not show it.
Plot, Table, Value, and State expose base display format from the Data row. Raw display format is context-menu only: right-click a Raw value cell. Log and Action do not offer per-signal value formatting.
Supported value formats are Default, Hex, Binary, Octal, and Scientific. Incompatible formats are disabled for the signal's data type or dictionary encoding. Formats are stored per panel, so the same signal can use different formats in different panels.
Signal chips
Resolved chips provide quick signal controls:
- Drag a chip to another compatible panel or tab.
- Click a Plot chip to show or hide its series.
- Click its color swatch to set a source-specific color where the panel supports colored series.
- Right-click for display-format and copy actions.
- Use the X button to remove the signal.
Scope and segment labels appear when needed to distinguish matching sources or overlapping data.
Export panel data
Click the Download button in the panel header, then choose:
- Export as CSV
- Export as JSON
- Export as TXT for Log panels
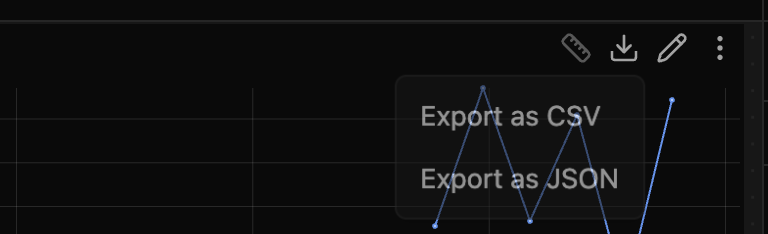
Exports include the panel's configured signals over the active timeline range. CSV is convenient for spreadsheets and data frames; JSON also preserves panel and range metadata. Action panels do not use the panel-data export menu.