Table Panel
The Table Panel lets you inspect signal values in a high-density grid with fast sorting, filtering, and scope-aware signal display.
Overview
The table panel is timeline-aware:
- In live follow mode, it shows the latest values.
- In paused mode (live or trace), it shows values at the timeline cursor.
- During playback, values advance with the cursor.
Value lookup uses step-before behavior, so if no sample exists exactly at the cursor, the latest sample at or before the cursor is shown.
Columns
The current table columns are:
- Signal: Signal name, including trace/agent scope when needed
- Value: Current value at the active timeline point
By default, tables use short signal names for readability. Use panel settings to switch to full signal paths when you need more context.
Working with Signals
Add signals by dragging from the sidebar or through Edit Panel -> Data.
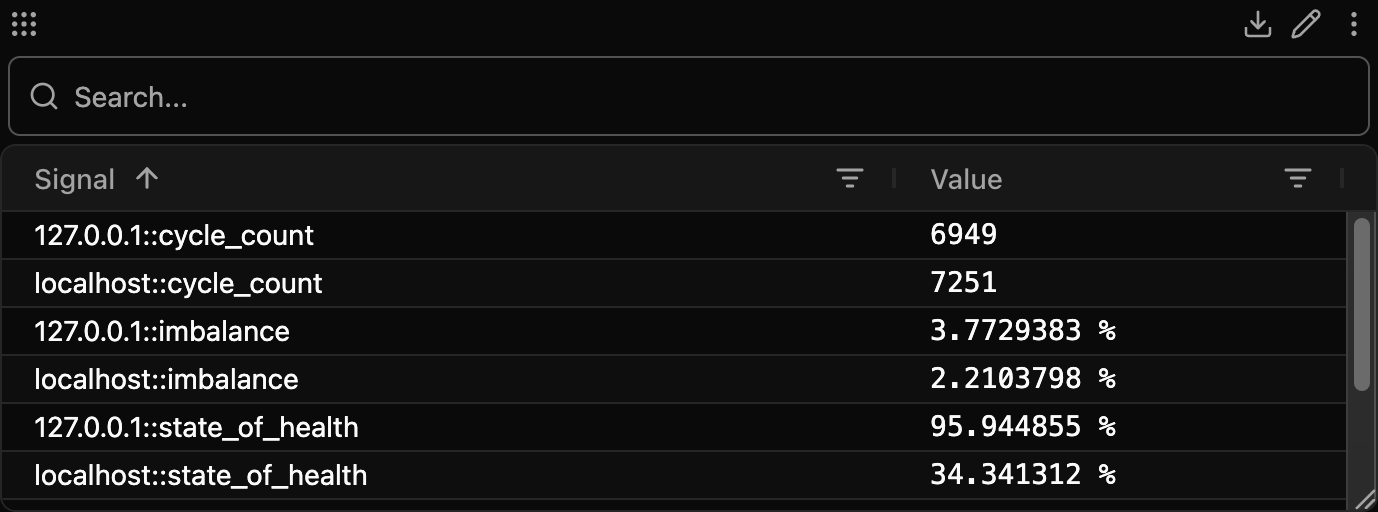
When a panel signal is portable (not bound to a specific producer/trace), the table can show multiple rows for that signal path, one per matching source.
Multi-Agent and Multi-Trace
The table supports mixed data sources:
- Multiple live agents in one panel
- Multiple trace files in one panel
- Portable and scoped signal bindings in the same panel
When sources share signal paths, scope labels are included in signal display to avoid ambiguity.
Show Empty Signals
Edit Panel -> Config -> Show empty signals (on by default) keeps configured signals listed even when they have no value at the current timeline point.
- On: every configured signal keeps a row. Rows with no value are muted and show
-in the Value column. - Off: only rows with current data are shown.
Muted rows come in two kinds:
- Empty -- plain muted. The signal has no data in the current view; the signal cell tooltip reads No data in this time range. Scroll or zoom the timeline back over its data and the value fills in.
- Unavailable -- the Signal cell shows an unplug icon. The signal's source is offline or its path was not found. The tooltip gives the reason, such as Source
robotdisconnected, Sourcedrive.trzclosed, or Not found in any connected source.
The default for new panels is set in Settings -> Panels -> Table.
Value Formatting
The table formats values using signal metadata:
- Numeric values are shown with plain formatting (no locale grouping)
- Objects are stringified for readability
- Value-table mappings (enums) are applied automatically when available
Display Format
Right-click any cell in the Signal or Value column to change how that row's values are rendered. The menu offers five formats: Default, Hex, Binary, Octal, and Scientific, and can also copy the displayed value or signal path. Where the signal type supports formatting, the same formats are available from Edit Panel -> Data -> the per-row ellipses menu.
Formats are stored per panel: the same signal placed in two Table panels can render values as 0xFF in one and 255 in the other. Formats travel with the signal on panel-to-panel drag-and-drop, and persist across reload and workspace save/load.
The table's quick-filter search matches against the currently-displayed string: when a row is showing Hex the filter accepts 0xFF; when the same row is reset to Default the filter accepts 255. Hex / Binary / Octal apply to integers directly; for floats, integer-valued floats render short (42.0 -> 0x2A) and fractional floats render as the IEEE 754 64-bit bit pattern. Dictionary-encoded signals only support the default label rendering, so non-default kinds are greyed out in the picker. When a non-dictionary signal has a value-table hit, the label is preserved alongside the formatted raw (Run (0x1)) so the enum meaning survives the format override.
Sorting
Click a column header to cycle sort direction:
- Ascending
- Descending
- None
Sort state is reflected directly in the column header.
Search
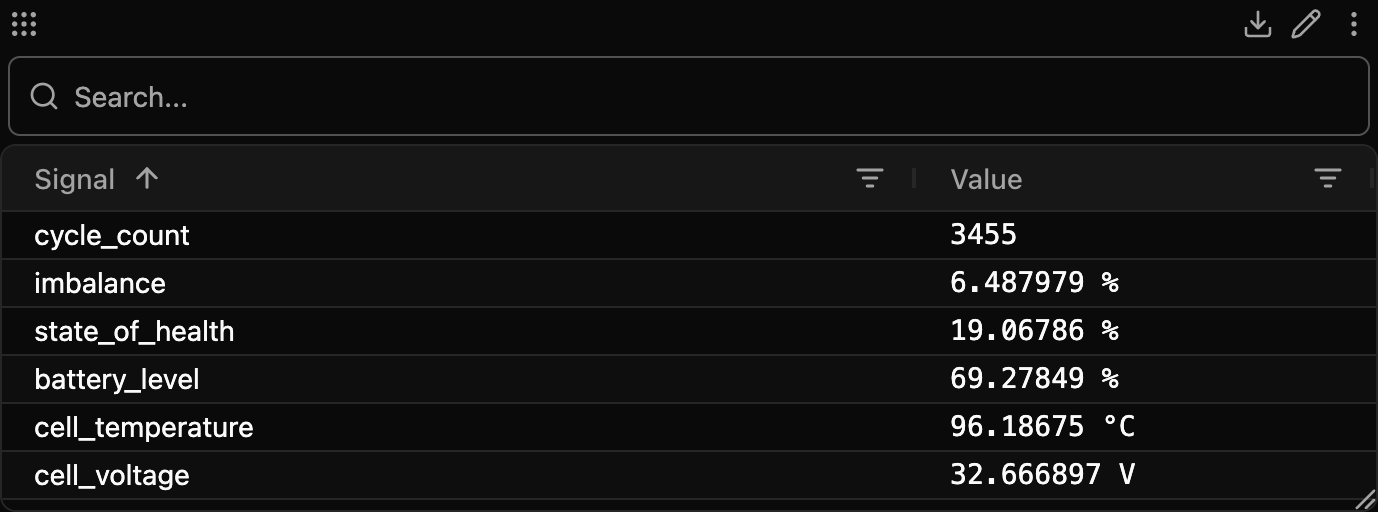
Use the search bar above the grid to filter rows across signal display text and values. Type to filter, or clear the input to restore all rows. Matches are highlighted in the cells, and the search accepts glob patterns (*soc*, motor?).
Column Filters
Both columns also carry a filter — the same one on every grid panel (Table, Raw, and Log). Hover the Signal or Value header, click its filter icon, and pick a condition (Contains, Equals, Begins with, …). The filter matches the text the column shows, so the Value column filters on the value exactly as displayed, unit and format included.
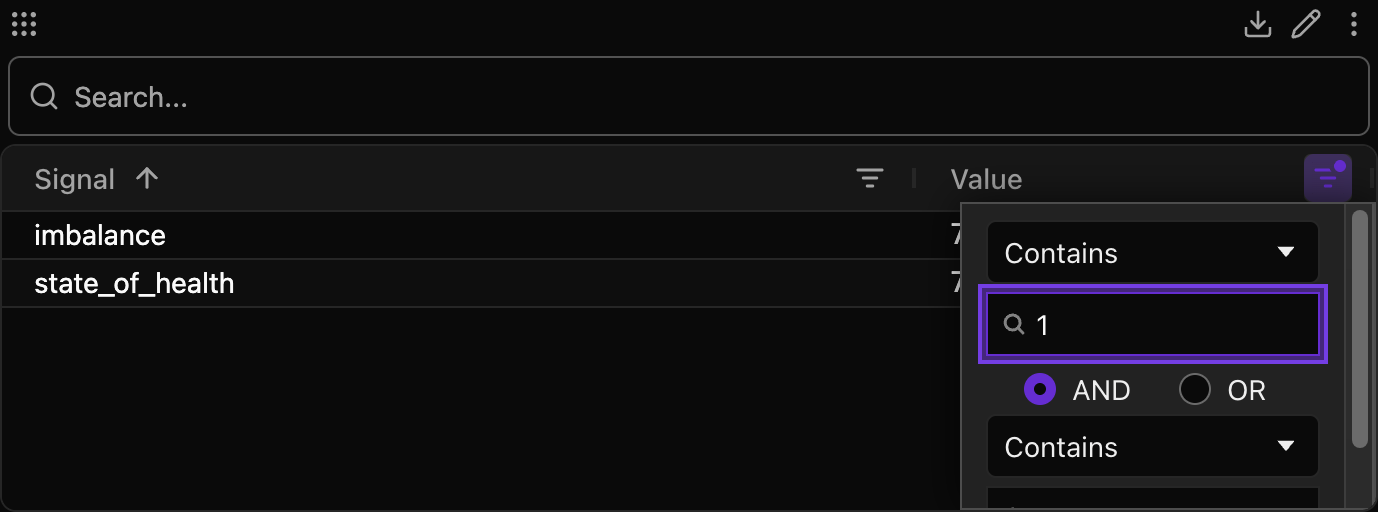
Column filters combine with AND and stack with the search bar, and a filter is saved with the panel. The two do different jobs: the search is a single glob across the whole row ("anything, anywhere that reads soc"), while a column filter is a text condition on one column ("the Value column, exactly 255").
Column Sizing
- Drag a column divider to resize
- Double-click a divider to auto-fit based on content
- Column width, order, and pinning are preserved when you return to the panel
Removing Signals
Right-click a row and choose Remove signal to remove that signal binding from the panel.