Log Panel
The Log Panel displays structured log data in real-time with powerful search, filtering, and formatting capabilities.
Overview
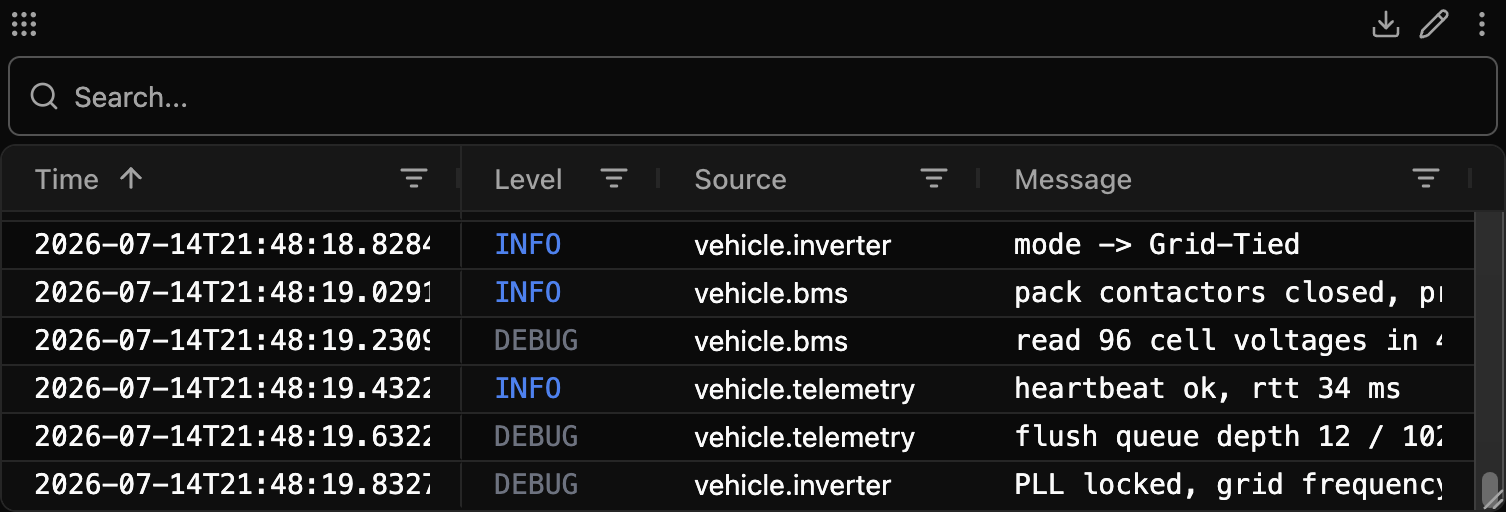
The log panel presents log entries in a grid, in the order they happened, with a column per log field. Each entry keeps its original formatting, including ANSI color codes for terminal-style output.
Basic Usage
Adding Log Sources
Drag and drop log signal sources from the signal tree directly onto the log panel. Each source contributes log entries with level, source name, and message information.
Columns
Every entry is one row across a fixed set of columns — the fields of the zelos.log.v1 schema, in the order a log line reads:
- Time - Entry timestamp, pinned to the left, rendered in the app's current time mode
- Level - Log severity (TRACE, DEBUG, INFO, WARN, ERROR, CRITICAL)
- Producer - The agent or trace the line came from
- Source - Component or service name that generated the log
- File - Source file the line was logged from
- Line - Line number within that file
- Message - The log message, with ANSI formatting preserved
Every column except Time can be hidden — see Column Visibility. The Producer column appears automatically whenever the workspace has more than one producer to tell apart, whatever the toggle says: without it, identical lines from two agents are indistinguishable.
Sorting
Time is the only sortable column. Click its header to cycle ascending, descending, and back to unsorted. Sorting a log by source or level would shuffle the lines out of the order they happened in, which is the one thing a log guarantees.
Auto-Scroll Behavior
The panel automatically scrolls to show new entries as they arrive. Scroll up to examine older entries and it detaches, offering a Resume following button to return to the tail. When the timeline cursor is pinned to an entry, that button reads Jump to cursor instead.
Jump Timeline Cursor from Logs
You can jump the global timeline cursor directly from a log entry:
- Right-click any log cell
- Choose Set cursor here
- The timeline cursor moves to that entry's timestamp, and other panels (plot/table/value) sync to that time
- If you scroll away, use Jump to cursor to re-center on the cursor entry
Context Menu
Right-click any cell for a menu scoped to the cell you clicked:
- Set cursor here - Move the global timeline cursor to this entry
- Copy value - Copy exactly what that cell shows on screen — a timestamp, a level, a file path, or the message as read (ANSI already stripped)
- Copy row as JSON - Copy the whole entry as JSON (
time_s,level,source,producer,trace,message,file,line), raw, with ANSI escapes intact
Search Functionality
Basic Search
Use the search bar at the top to find specific log entries:
- Type to search - Results update instantly as you type
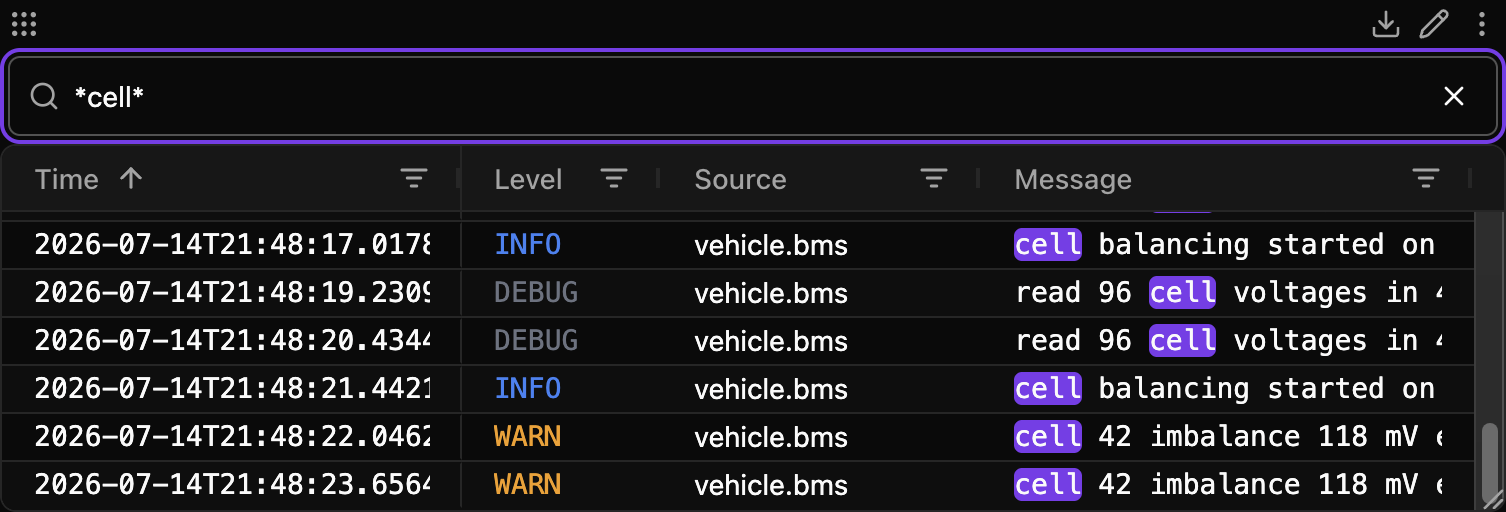
- Highlight terms - Matching text is highlighted as you type
- Search scope - Searches the plain-text version of log messages only. Filtering by a level or a source is what the column filters are for, so a search for
12doesn't also match every timestamp containing it. - Clear search - Click the X button in the search bar to reset
Advanced Search Patterns
The search supports glob patterns for complex queries:
Wildcard Patterns
error*- Matches entries starting with "error"*connection*- Matches entries containing "connection"user?.log- Matches "user1.log", "userX.log", etc.
Keyboard Shortcuts
- Ctrl/Cmd + F - Focus the search bar. Click into the panel first: while focus is inside a panel the shortcut belongs to that panel's search, and outside it, to the sidebar search.
Filtering System
Column Filters
Every column header carries the same filter — the one on every column, and the same the Table and Raw panels use. Hover a header, click its filter icon, and a small popup opens: choose a condition (Contains, Equals, Begins with, …) and type. The column matches the text it shows, so the Level column filters on INFO, the Source column on vehicle.bms, and the File column on a path fragment.
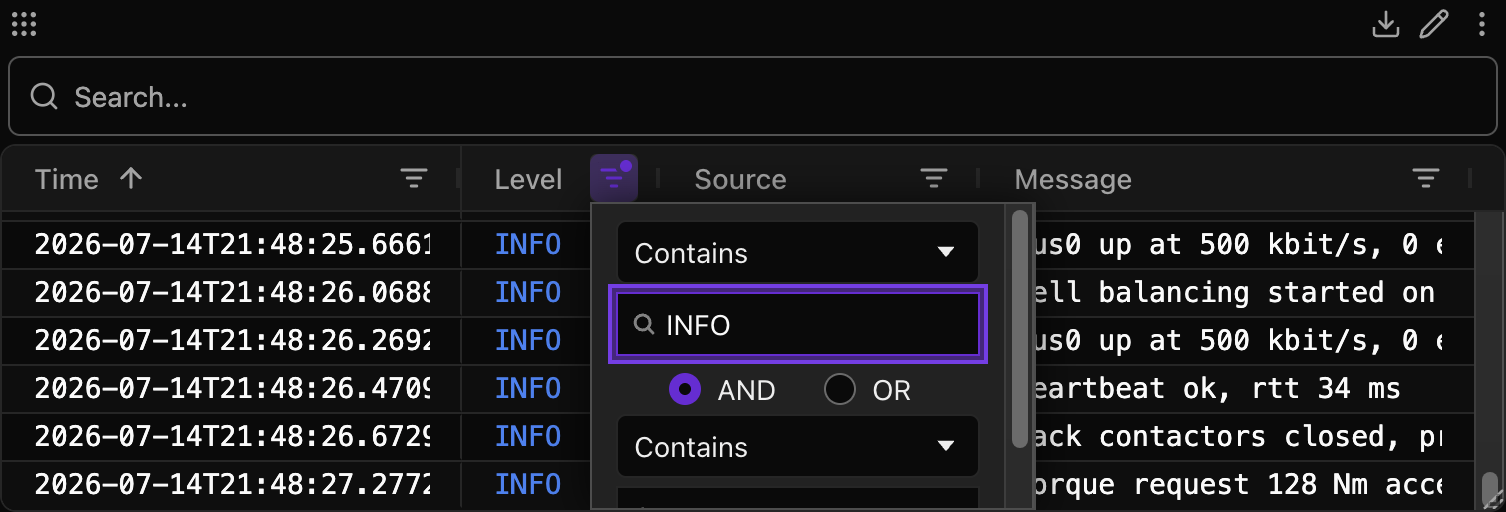
Filters on different columns combine with AND, and stack with the search bar — both narrow the same rows.
Filtering by Level
Open the Level column's filter and type a level to keep only matching lines. Use Equals WARN for one exact level, or Contains to match a family — err keeps ERROR, since the match is a case-insensitive substring. The filter matches the level text as shown, already uppercased and normalized (see Level Colors).
Level Colors
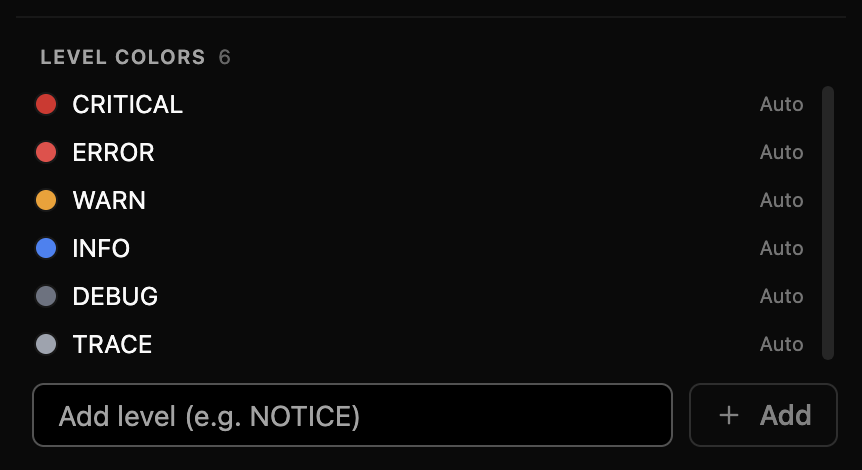
- TRACE - Gray (lowest severity)
- DEBUG - Gray
- INFO - Blue
- WARN - Amber
- ERROR - Red
- CRITICAL - Dark red (highest severity)
Levels are matched loosely, so whatever spelling a framework uses lands on the right color and the right rank: WARNING, warn, and WRN all read as WARN; FATAL reads as CRITICAL; VERBOSE reads as TRACE. An unrecognized level ranks as DEBUG rather than shouting in red.
Filter Behavior
- No filter set - A column with no filter shows all of its entries
- Across columns - Active column filters combine as AND — a line must satisfy every one
- With search - Column filters and the search bar combine; both must match
- Persistent filters - Filter selections are saved with the panel and restored with the layout
Customization and Settings
Defaults for new Log panels live in Settings -> Panels -> Log.
Display Options
Access through Edit Panel -> Config:
Column Visibility
- Show Timestamps - Toggle the Time column
- Show Log Levels - Toggle the Level column
- Show Producers - Always show the Producer column (it appears on its own when the workspace needs it)
- Show Sources - Toggle the Source column
- Show File - Toggle the File column
- Show Line - Toggle the Line column
Message Display
- Wrap Messages - Wrap long messages instead of scrolling them horizontally within their cell
Font Settings
- Font Size - The size of the log text, in pixels (default 14). Row height follows it.
Buffer Management
- Buffer Size - Maximum number of log entries to retain
- Auto Scroll - Automatically scroll to new entries
Level Color Customization
Customize the color of each log level in Edit Panel -> Data -> Level colors:
- Click the color swatch next to the level name
- Choose from palette or use the color picker for custom colors
- Colors persist across sessions and are saved with the panel
ANSI Color Support
Terminal Formatting
The log panel preserves and displays ANSI escape sequences from terminal output:
Supported Features
- Foreground colors - Text colors
- Background colors - Background colors
- Text formatting - Bold, dim, italic, underline
- Reset sequences - Proper handling of color resets
Display Behavior
- Original formatting - Colors and styles displayed as intended
- Searchable text - Search operates on plain text without ANSI codes
- Copy behavior - Copy value on a message cell copies the line as read, without escape codes; Copy row as JSON keeps them
Advanced Features
Buffer Management
- Configurable buffer - Set maximum entries to retain in live mode
- Automatic pruning - Old entries removed when buffer limit exceeded
Time Range Integration
- Live mode - Shows logs from recent time window
- Historical mode - Displays logs from selected time range
Column Sizing
- Drag a column divider to resize
- Column width, order, and sort are preserved when you return to the panel
Export Data
The log panel supports exporting data in multiple formats:
- CSV - Tabular format with timestamp, level, source, and message columns
- JSON - Structured format with metadata and log entry arrays
- TXT - Plain text format preserving original message formatting
Exports use the panel's configured signals and the selected timeline range. Column filters and the search term are not applied to exported data — an export is the full raw data for every signal in the panel.
Buffer Limitations
In live mode, the buffer size limits how many log entries are retained. Very high-volume logging may cause older entries to be pruned. Increase buffer size or apply filters to retain more relevant entries.