Raw Panel
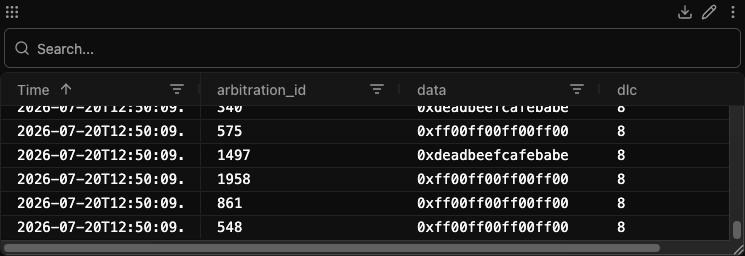
The Raw Panel shows the raw records behind your signals: one row per event as it was recorded, in the order it happened, with one column per field.
Where a Table panel answers "what is this signal right now?", the Raw panel answers "what actually arrived, and when?". It is the panel to reach for when you need the records themselves — every sample of a CAN message, every field of a state report — rather than a value at a point in time.
Overview
- One row per event record, over the timeline's current time range (live or trace).
- One column per signal in the panel, plus a Time column pinned to the left.
- Rows arrive in time order and stay that way — a sequence, not a set.
Adding a Raw Panel
- Choose Add Panel -> Raw in the timeline toolbar.
- Drag signals onto an existing Raw panel to add columns.
Dropping a whole event into empty layout space does not create a Raw panel. Non-log events create a Plot panel, while zelos.log.* events create a Log panel.
Columns
A column is a signal, so everything that identifies the signal lives in the header, not repeated down every row:
- Time - the record's timestamp, pinned left, rendered in the app's current time mode.
- One column per signal - the signal's name, plus its unit in parentheses when it has one.
Headers disambiguate exactly as the other panels do: the producer appears when the workspace has more than one to tell apart, the trace when several are open, and the segment for overlapping data segments. When the panel holds fields from more than one event, headers show full signal paths.
Cell values go through the app's shared formatter, so enum and dictionary fields render their mapped label (Drive) rather than the raw code (1). A cell with no value for that record shows -.
Raw byte fields — a CAN frame's data, a UDS response — render as a hex string (0xDEADBEEFCAFEBABE). Any numeric column, such as a CAN arbitration ID, can be switched to Hex, Binary, Octal, or Scientific from its Display format menu.
Sorting
Time is the only sortable column. Click its header to cycle ascending, descending, and back to unsorted. Ranking records by a value would destroy the one thing a sequence of events guarantees — the order they happened in.
The Time sort also decides which end of the time range fills the buffer: sorted descending, the panel keeps the most recent records in range; ascending, the earliest.
Filtering
Every column header carries the same filter — the one the Table and Log panels use too. Hover a header and click its filter icon for a small popup: pick a condition (Contains, Equals, Begins with, …) and type a value. The column matches the text it shows on screen, so an enum column is filtered by typing its label (Drive), never its raw code.
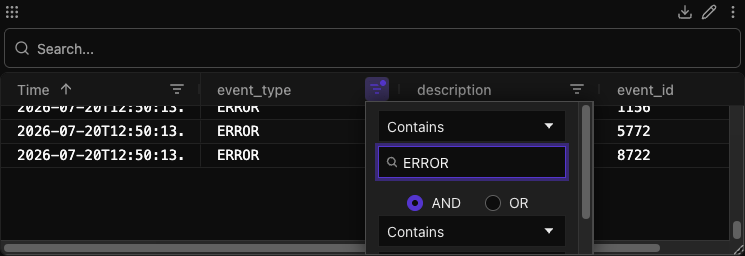
Filters on different columns combine with AND, and stack with the search bar above the grid — both narrow the same rows. A column filter is saved with the panel and restored when you reopen the layout; clear it by emptying its box.
Column filtering and the search bar do different jobs: a column filter is a text condition on one column, while the search is a single glob across the whole row. Reach for the search when you want "anything, anywhere that reads fault", and a column filter when you want "this field, exactly these values".
Search
The search bar above the grid filters rows across every column:
- Type to filter; matches are highlighted in the cells.
- The search accepts glob patterns (
*fault*,gear?); the whole query is one pattern. - It matches the text on screen, so an enum column is found by typing
Drive, never by knowing its raw code. - Ctrl/Cmd + F focuses this panel's search. Click into the panel first: while focus is inside a panel, the shortcut belongs to that panel's search, and outside it, to the sidebar search.
Following Live Data
While a live workspace is playing, the panel chases the tail: new records scroll into view as they arrive. Scroll away to inspect older rows and it detaches, offering Resume following to return to the tail.
Set the timeline cursor and the panel parks on the cursor row instead — the last record at or before the cursor, the same step-before rule the Plot and Table panels read values with. That row is highlighted, and the button reads Jump to cursor.
Turn the chase off entirely with Auto scroll in panel settings.
Context Menu
Right-click any cell:
| Item | Effect |
|---|---|
| Set cursor here | Move the global timeline cursor to this record's timestamp; other panels sync to that time |
| Display format | Default, Hex, Binary, Octal, or Scientific. A column is a signal, so this repaints the whole column |
| Copy value | Copy exactly what the cell shows on screen |
| Copy path | Copy the canonical signal path (source/message.signal) |
| Copy row as JSON | Copy the whole record as JSON — time_s plus one key per signal, with raw values, so it stays lossless for a machine to read |
| Remove signal | Drop that signal from the panel, i.e. remove its column |
The Time column has no signal behind it, so its menu offers only the cell-scoped rows.
Display formats are stored per panel signal, exactly as in the Table and Plot panels: the same signal can render hex in one panel and decimal in another, and the format follows the signal when you drag it elsewhere.
Raw display formatting is available only from the cell context menu, not from Edit Panel -> Data.
Settings
Access through Edit Panel -> Config:
- Font Size - the size of the row text, in pixels. Row height follows it.
- Auto Scroll - follow new records as they arrive in live mode.
- Buffer Size - the maximum number of records the panel retains (default 2,000). Older records are pruned once it is full.
Defaults for new Raw panels live in Settings -> Panels -> Raw.
Buffer limits
A high-rate event can fill the buffer quickly, so the panel may hold only the most recent slice of the range. Raise the buffer size, or narrow the timeline, to see more.
Column Sizing
- Drag a column divider to resize.
- Column width, order, and sort are kept for as long as the workspace is open.
Export Data
The Raw panel exports as CSV or JSON, like every other signal panel — see Export panel data.
Exports use the panel's configured signals and the timeline's selected range. Column filters and the search term are not applied — an export is the full raw data for every signal in the panel.