Value Panel
The Value Panel presents one or more signals as large, timeline-aware readouts. Use it when you want fast status checks without opening a full table or plot.
Overview
The displayed values follow timeline state:
- In live follow mode, the panel shows the latest value.
- In paused mode (live or trace), it shows the value at the timeline cursor.
- During playback, it updates as the cursor advances.
When there is no sample exactly at cursor time, the panel uses step-before lookup (latest sample at or before the cursor).
Using the Value Panel
Adding Signals
To build a Value panel:
- Add a Value panel: Click Add Panel in the timeline toolbar, then select Value
- Drag a signal: Drop any signal from the tree onto the panel
- Add more signals: Drop additional signals onto the same panel, or add them from Edit Panel -> Data
- View updates: The panel keeps every visible value synced to live/latest or cursor-time data depending on timeline state
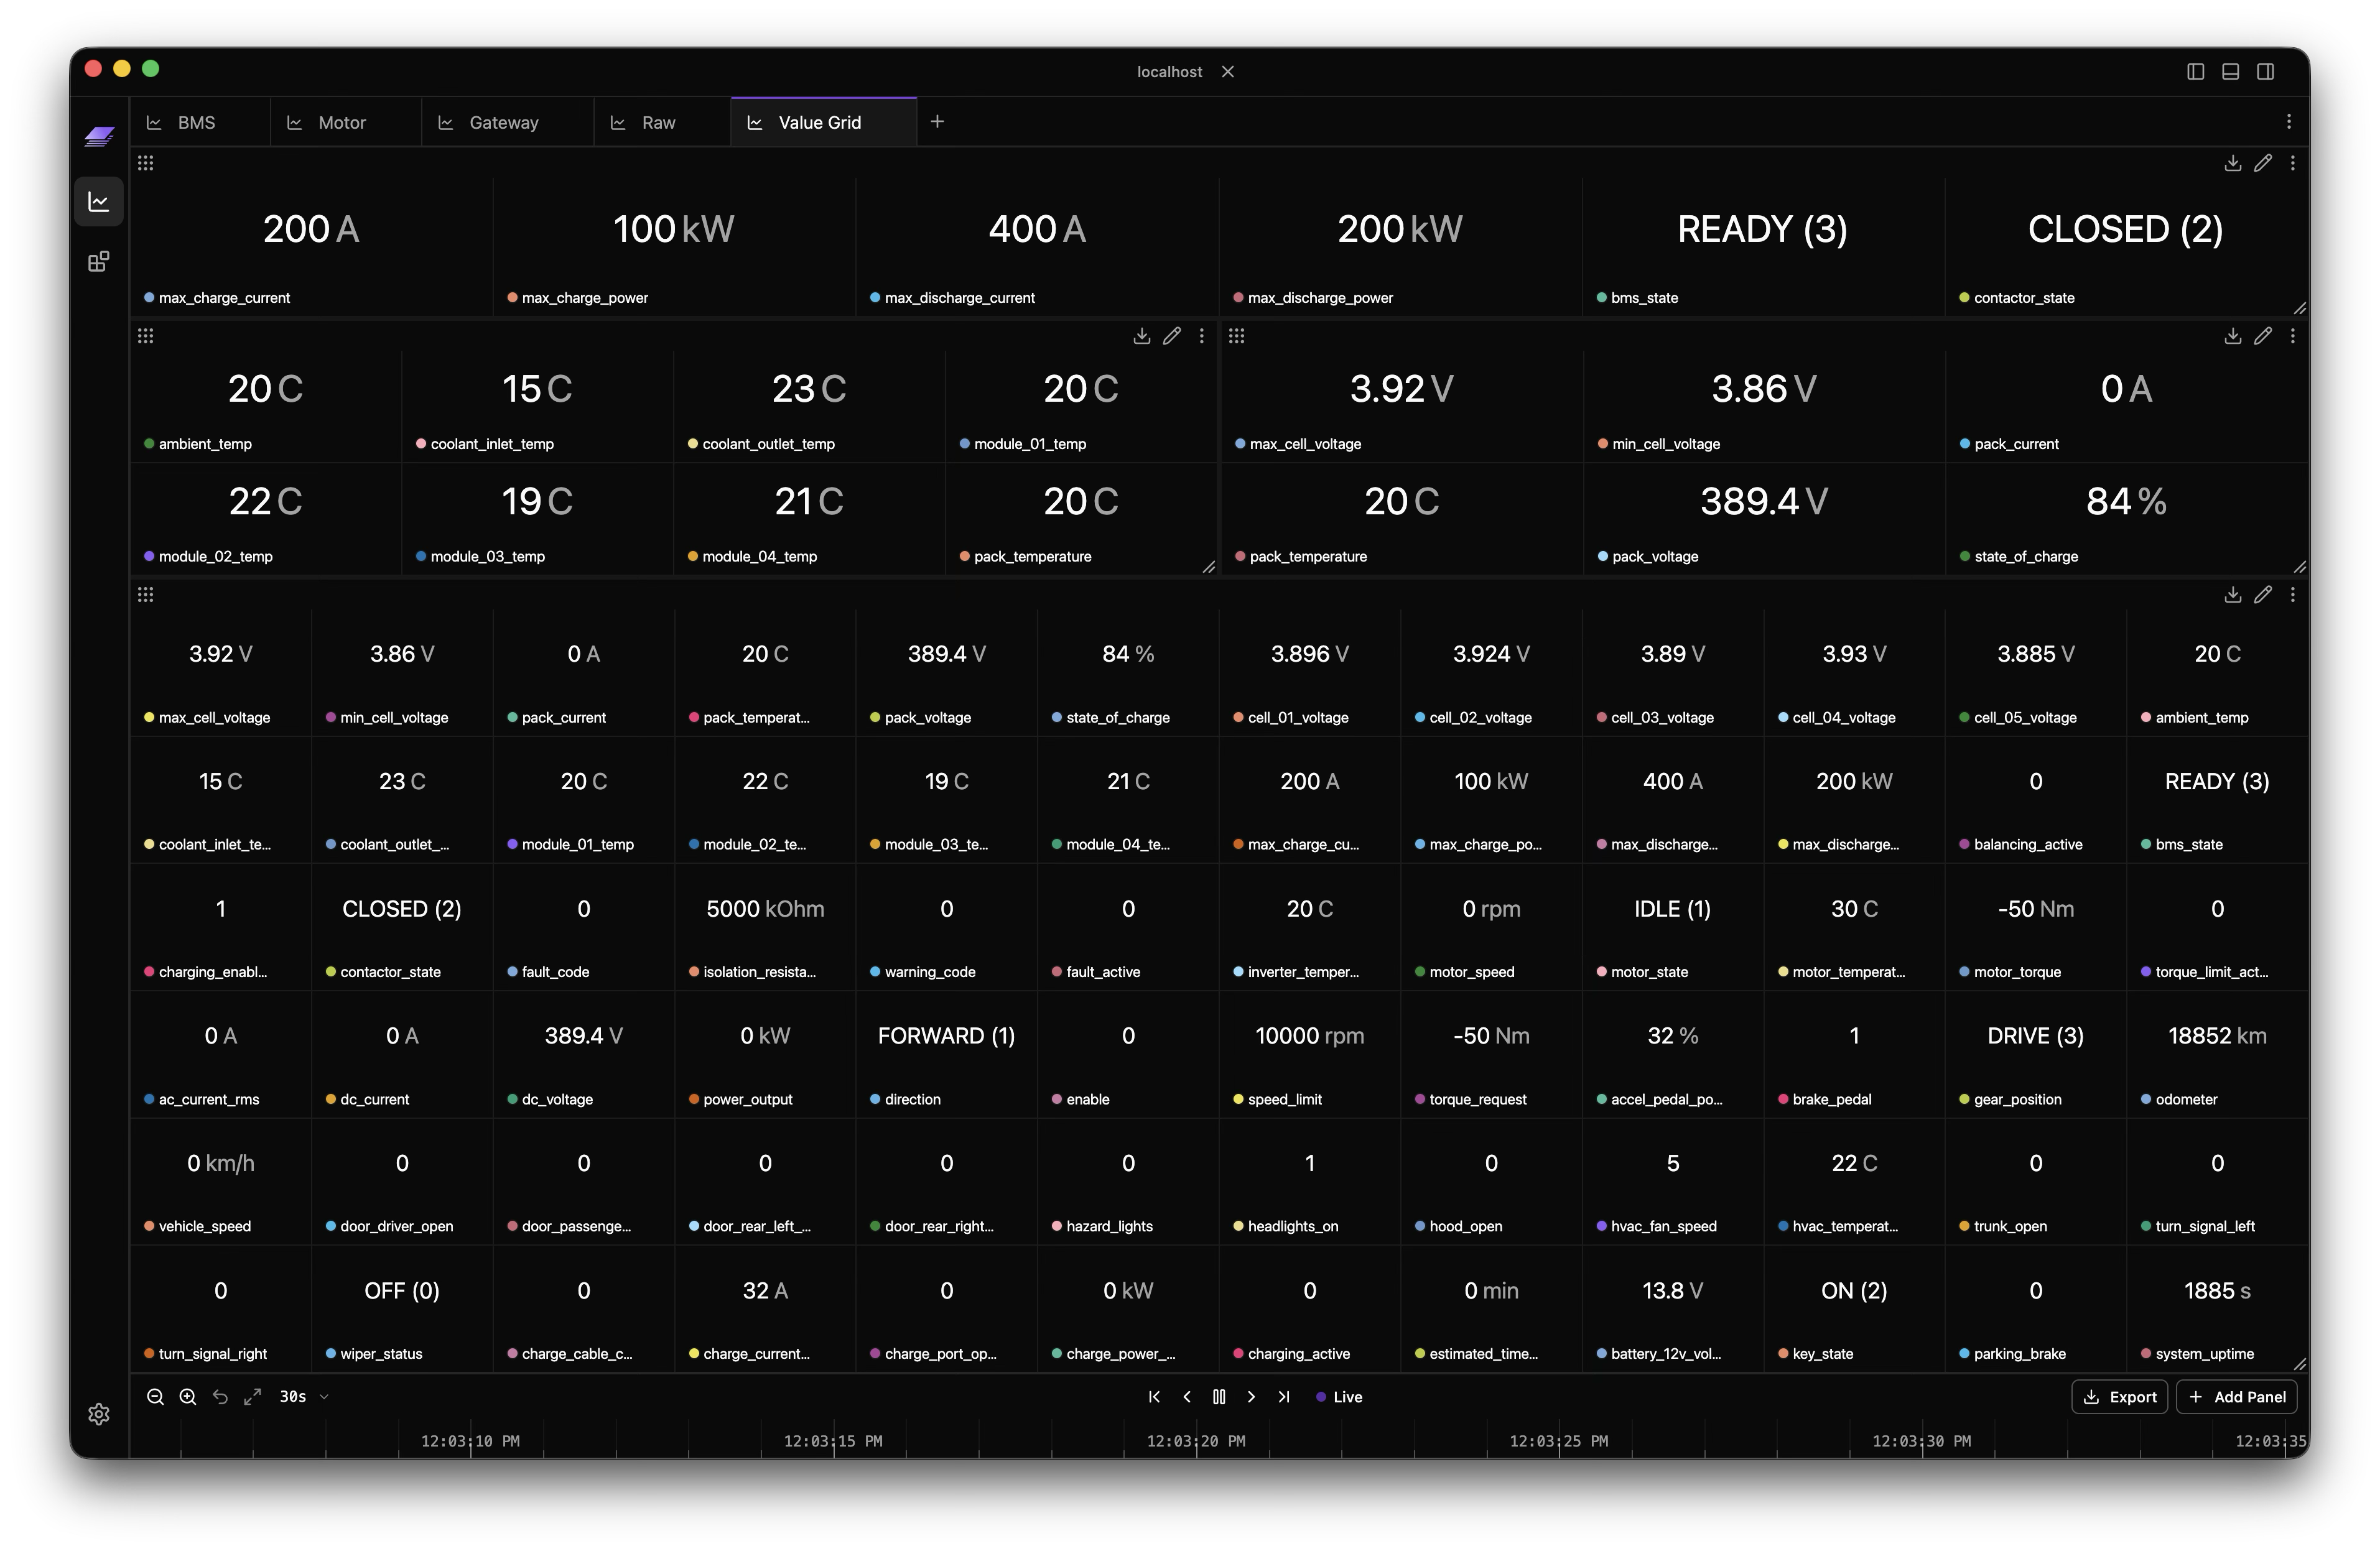
Grid Behavior
A Value panel can stay focused on one signal or act as a compact value dashboard.
- Each configured signal can render as its own cell in a grid
- Zelos chooses a compact layout automatically, or you can set Columns explicitly in panel settings
- Cells without a value at the active timeline point show a placeholder until data is available
- Chips appear for populated cells so you can inspect, remove, or drag the underlying signal
Multi-Agent and Multi-Trace Data
A portable signal (one that is not scoped to a specific agent or trace) can render multiple cells when more than one matching data source is active.
- One configured signal can show one cell per matching agent or trace
- Each cell keeps its own chip and scope context so the sources stay distinguishable
- Scoped signals continue to show only the specific agent and/or trace you selected
Overlapping Segments
When the same signal appears in overlapping segments from the same source, Zelos can split that signal into multiple cells so the values do not overwrite each other visually.
- Expanded cells show segment labels on their chips when overlap needs to be disambiguated
- When the overlap is no longer visible in the current time window, the panel collapses back to the best matching value
- Segments outside the current view are hidden from the grid
Value Display Features
Enum Mapping
When signals have associated value tables (enums), the panel translates numeric values to readable labels.
Example mappings:
- Status code
0->"OK" - Mode value
3->"AUTO" - Error code
255->"CRITICAL_FAULT"
When available, mapped and raw values are shown together (for example: AUTO (3)).
Data Type Support
The Value panel handles all Zelos data types:
| Type | Display Example |
|---|---|
| Integer | 42 |
| Float | 3.14159 |
| String | "Active" |
| Boolean | true or false |
| Enum | RUNNING |
| Null | null |
Display Format
Right-click a signal chip -- or any value cell -- to change how that signal's value is rendered in this panel. The menu offers five formats: Default, Hex, Binary, Octal, and Scientific. The same formats are also reachable from Edit Panel -> Data -> the per-row ellipses menu. The same menu can copy the displayed value or signal path to the clipboard.
Formats are stored per panel: the same signal placed in two Value panels can render as 0xFF in one and 255 in the other. Formats travel with the chip on panel-to-panel drag-and-drop. Dragging a signal from the sidebar into a panel that already shows that signal preserves the existing format.
Hex / Binary / Octal apply to integers directly. For float values they apply as follows: integer-valued floats (like 42.0) render in the short form (0x2A); other floats render the IEEE 754 64-bit bit pattern (for example, 3.14 becomes 0x40091EB851EB851F). Dictionary-encoded signals (value-table covers every raw value) only support the default label rendering, so non-default kinds are greyed out in the picker. When a non-dictionary signal has a value-table hit (for example, a uint8 gear-state signal mapping 1 -> "Run"), the label is preserved alongside the formatted raw so the enum meaning survives the override: Run (0x1) instead of the bare 0x1. Formats persist across reload and across workspace save/load; they are stripped from persisted JSON when unset.
Signal Chip
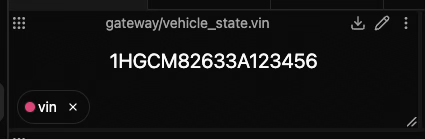
Each populated cell shows a signal chip at the bottom. Chips provide:
- Signal name: Full path or shortened based on settings
- Scope context: Trace/agent labels when needed
- Segment context: Segment labels when overlapping segments are expanded
- Data type: Shown on hover (int, float, string, etc.)
- Quick removal: X button to remove that signal from the panel
- Drag capability: Move the signal to other panels or tabs
Panel Settings
Access settings through the panel menu (...) -> Edit Panel:
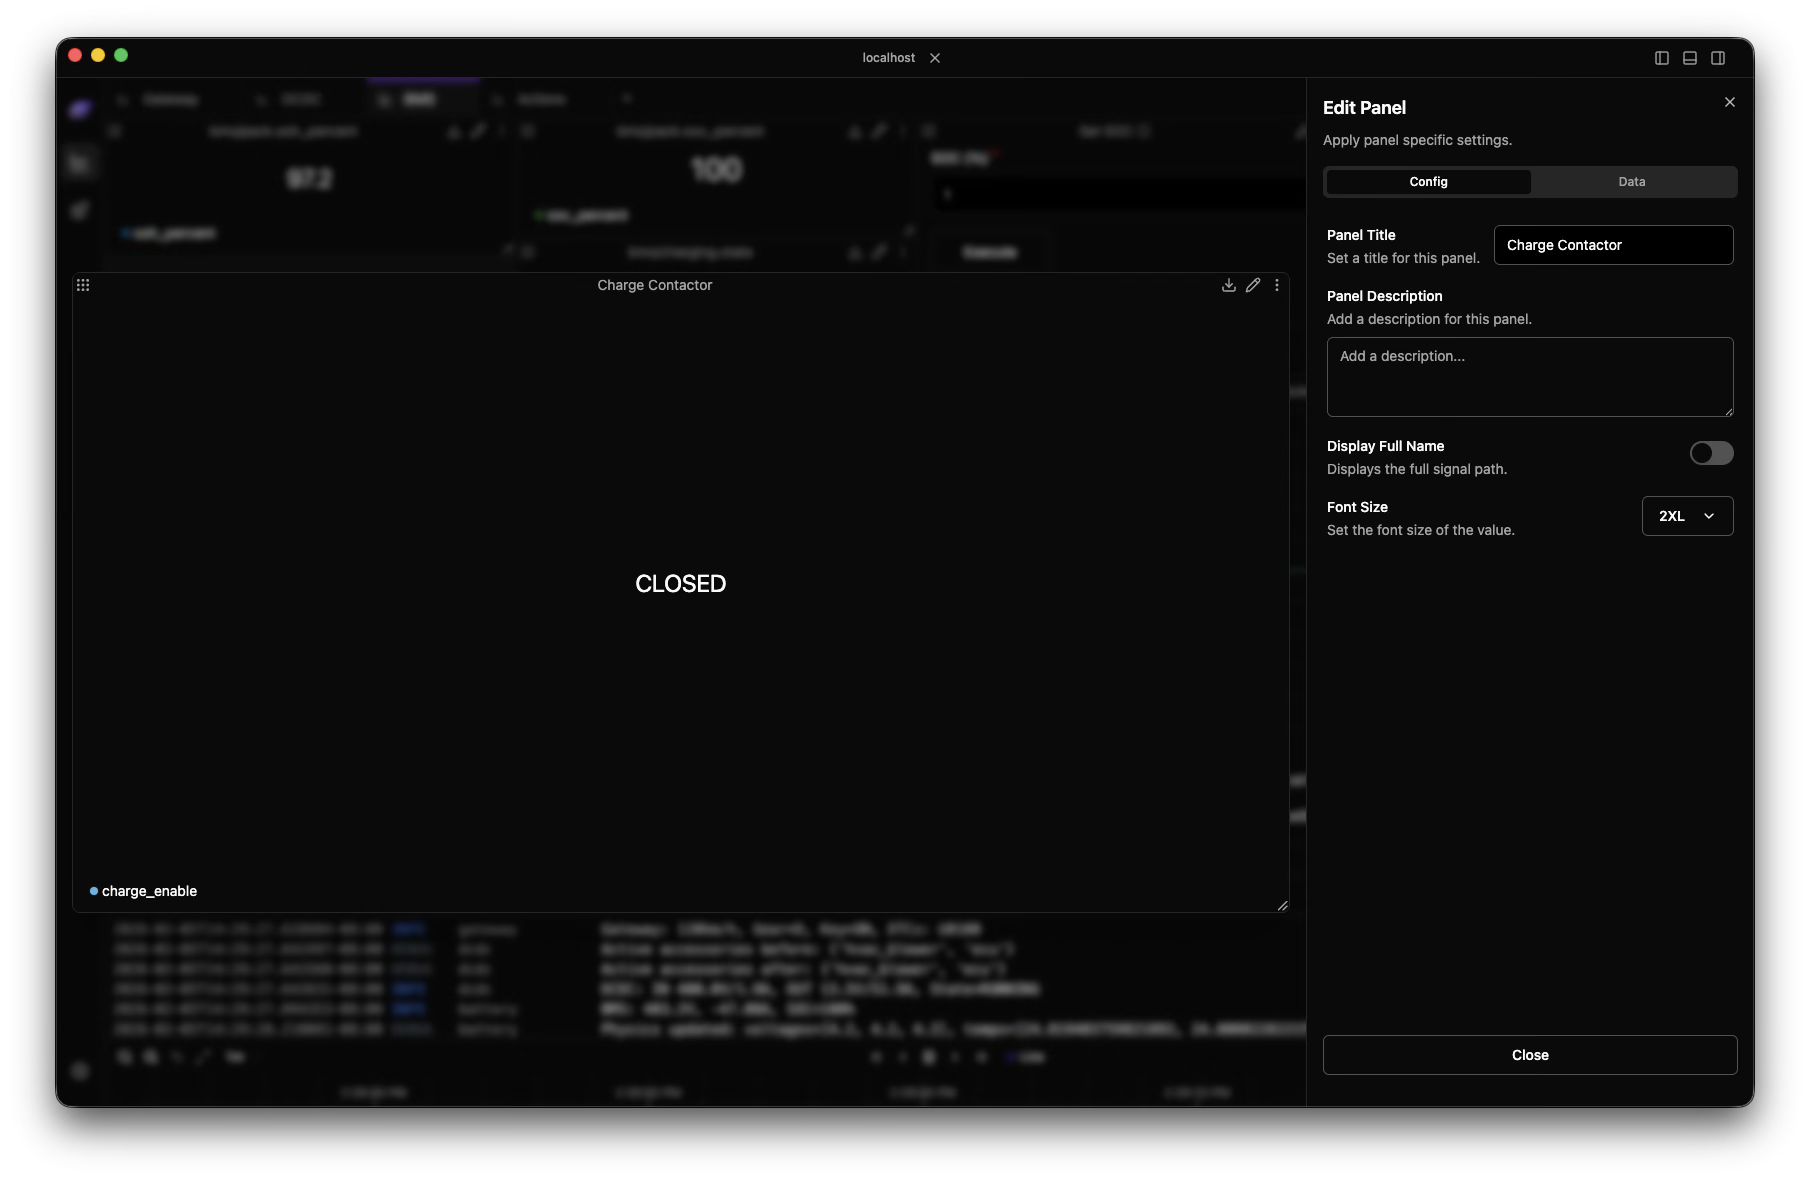
Display Options
Panel Title
Set a custom title. If empty, single-signal Value panels use the signal name. For multi-signal panels, setting a custom title is recommended.
Columns
Set how many columns the value grid should use before wrapping into additional rows.
Display Full Name
Toggle between:
- Full path:
robot/sensors.temperature - Short name:
temperature
Show Empty Signals
Keep configured signals visible even when they have no value at the current timeline point. On by default.
- On: every configured signal keeps a cell. Cells with no value show a faded
#and a muted chip. - Off: only cells that currently have data are shown.
Muted chips come in two kinds:
- Empty -- plain muted. The signal has no data in the current view; its tooltip reads No data in this time range. Scroll or zoom the timeline back over the signal's data and the cell fills in.
- Unavailable -- muted with an unplug icon. The signal's source is offline or its path was not found. The tooltip gives the reason, such as Source
robotdisconnected, Sourcedrive.trzclosed, or Not found in any connected source.
The default for new panels is set in Settings -> General -> Panel Defaults.
Font Size
Choose from six text-size options.
Data Tab
Use the Data tab in panel settings to manage the panel without dragging:
- Add more signals
- Remove signals
- Adjust signal scope
- Update signal colors
Export Data
Value panels use the same export flow as other panel types:
- Click the panel menu (
...) - Select Export Data
- Choose CSV or JSON
- Export includes the selected timeline range for the configured signals
 View More
-
Explore other visualization options
-
View historical trends of your values
-
Monitor multiple values in a table
-
Save your Value panel arrangements
Pro Tip
Pair Value panels with Plot panels and Table panels: Value for instant state, Plot for trend context, Table for dense comparisons.