Getting Started
Connect a data source and plot your first signal.
If you would rather be shown than read, the app offers a guided tour once a new install has signed in and joined an organization. It walks one real investigation end to end against a simulated site. Nothing it shows you is written to disk or sent anywhere, and it removes everything it made when it ends.
Initial Setup
Authentication
On first launch, choose your authentication method:
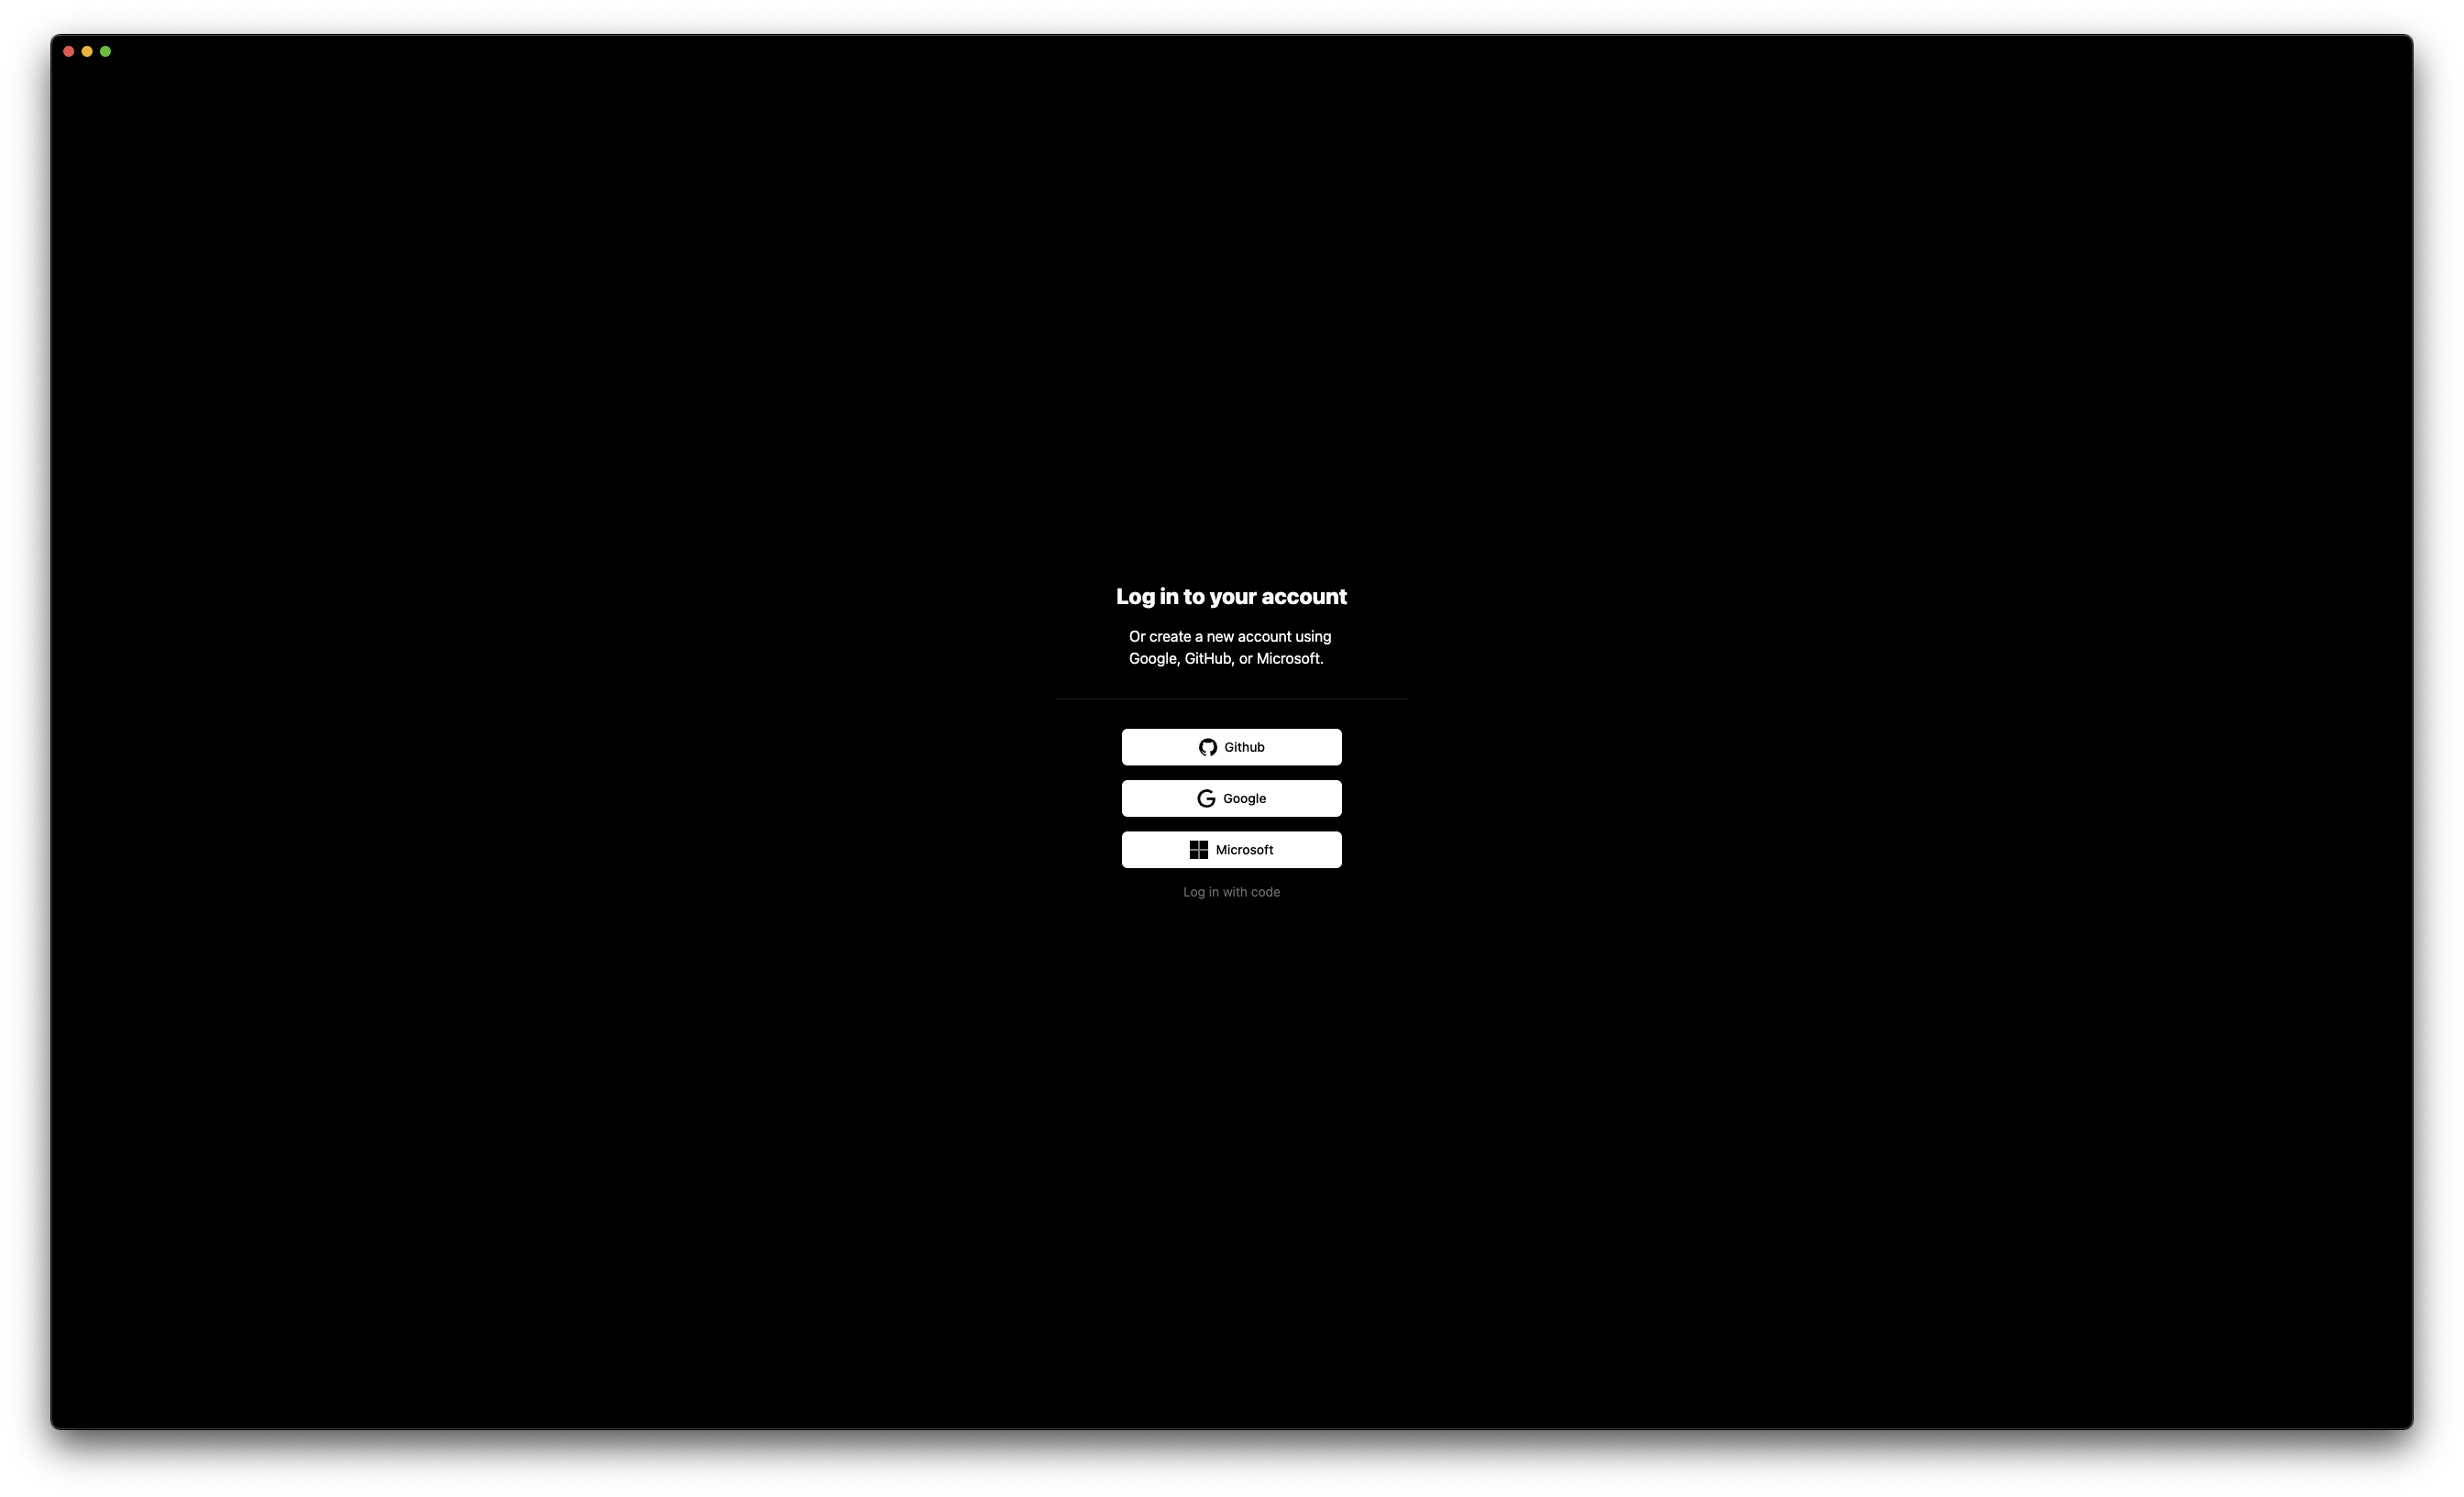
OAuth Providers
- Click your provider - GitHub, Google, or Microsoft
- Authorize in browser - Review permissions and approve
- Return to app - Authentication completes automatically
The browser shows Login Successful when the app has your session. Close the window and return to Zelos.
Device Code
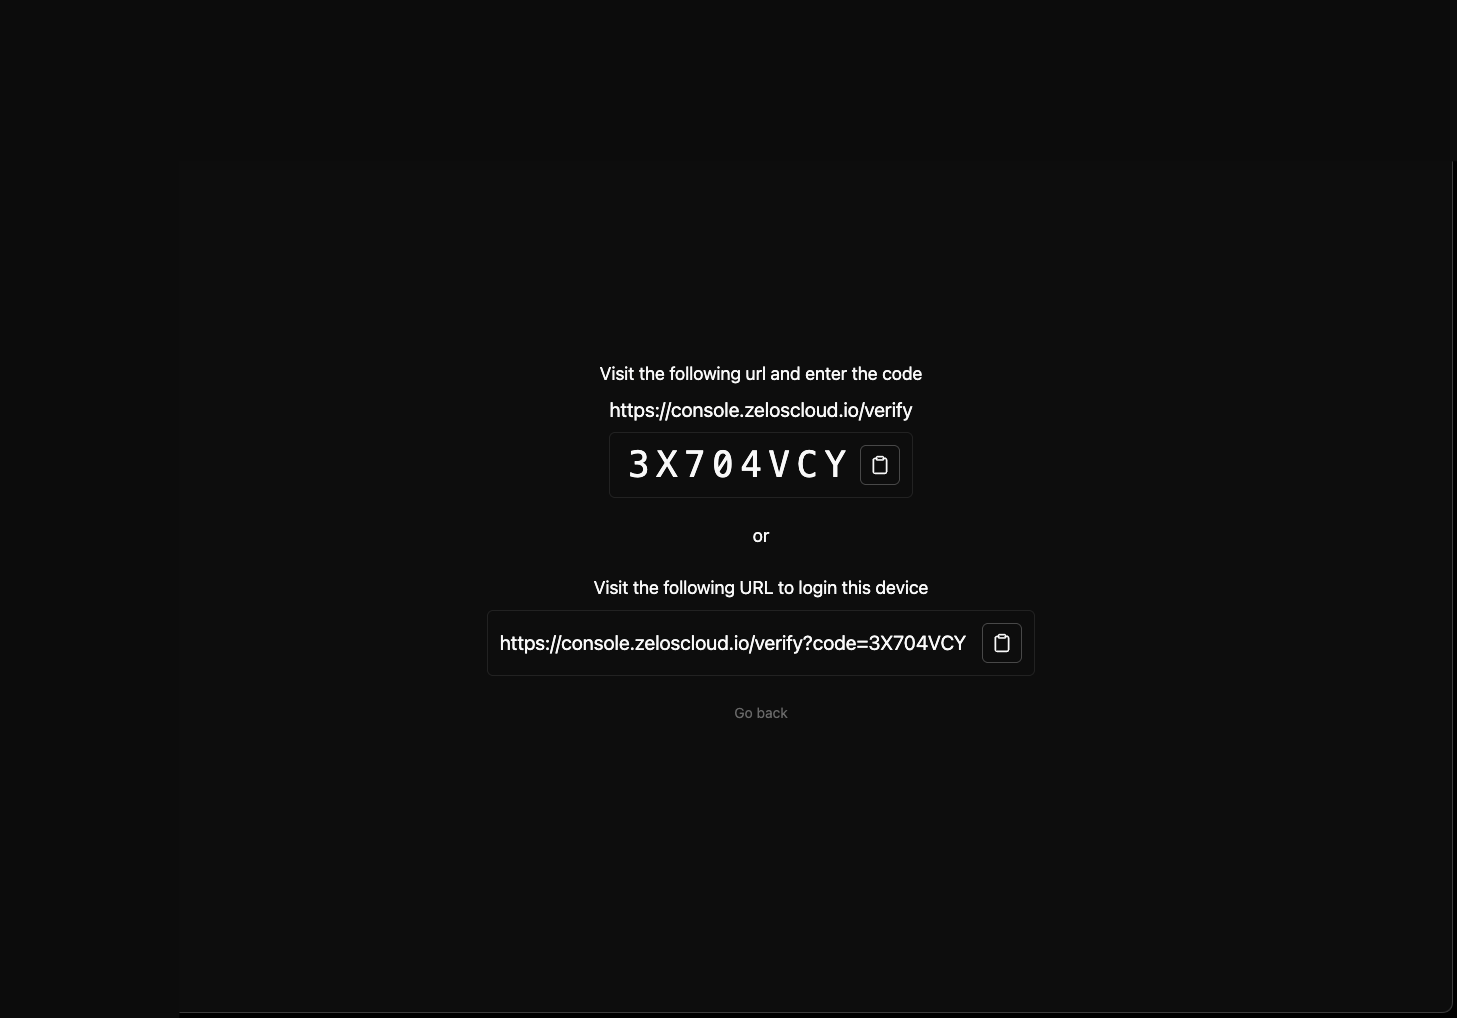
- Click Log in with code
- Copy the 8-character code (shown as
T9WK-VR2P) - On any device, open the URL the app shows —
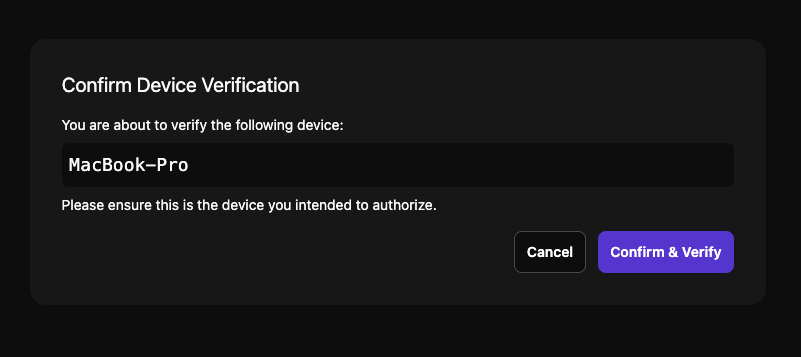
https://console2.zeloscloud.io/device - Enter the code and approve the device

Organization access
The first time you sign in without an organization, Zelos asks you to create one or join your team. You can come back to it later from Set up your organization on Home or in Settings. See Organizations.
After authentication, the app will:
- Create a default workspace - Your starting point for visualization
- Check for updates - Ensure you have the latest features
- Initialize local storage - Set up configuration and cache
- Start the local agent - Enable data reception on port 2300
Interface Overview
The app interface consists of:
- Command Palette (
Cmd+K/Ctrl+K) - Run commands from anywhere in the app - Left Sidebar (
Cmd+\/Ctrl+\) - Browse signals, actions, extensions, and notebooks; launch Settings and app extensions from its rail - Main Area - Workspace tabs for panel layouts, notebooks, Settings, and app extensions
- Right Sidebar (
Cmd+J/Ctrl+J) - Manage layouts, connections, and AI chat - Timeline (bottom) - Navigate time and control playback
All sidebars are resizable and their states persist across sessions.
Basic Workflow
Step 1: Connect to Data
You have two options for getting data into the app:
Option A: Live Connection
Connect to a running agent streaming real-time data:
- Click Connect localhost on Home
- The app connects to
localhost:2300by default - Your signal tree (left sidebar) populates with available data
Remote Agents:
To connect to a remote agent:
- Open the right sidebar (
Cmd+J/Ctrl+J) - Go to the Data Sources section
- Click New agent (it reads Add agent once one is connected)
- Enter the agent address (e.g.,
192.168.1.100:2300) - Press
Enteror click "Connect"
Your connection is saved for quick access later.
Option B: Open a Trace File
Load previously recorded data for analysis:
- Click Open trace on Home, the welcome screen Zelos opens to
- Select your
.trzfile - The timeline adjusts to the trace's time range
- Workspace switches to Trace mode
Quick Open
Double-click any .trz file to automatically launch the app and load the trace.
Step 2: Visualize Data
Once connected, add signals from the left sidebar to create visualizations:
Adding Signals
The Explorer view in the left sidebar lists every source, message, and signal:
Quick Methods:
Drag & Drop
- Expand sources and events to find your field
- Drag a field to the workspace
- Drop it into an existing panel to add it there, or drop it on empty layout space / a row boundary to create a new Plot panel automatically
Double-Click
- Double-click any field to create a new Plot panel with that signal
Multi-Select
Cmd+Click/Ctrl+Clickto select multiple fields- Drag any selected field to add them all at once
Folder Drag
Drag entire folders to add all signals within. This works at any level (source, event, or folder).
Starting with other panel types
Signal-first interactions create Plot panels. If you want to start with a Table, Log, or Value panel, use Add Panel in the timeline toolbar first, then drag signals into that panel.
Your first panel appears with the signal plotted over time. If it lands below the visible part of the current layout, Zelos scrolls it into view and briefly outlines it so you can see where it was added. Zelos stores the most portable binding it can for that panel, so the view is easier to reload and reuse later.
Essential Concepts
Workspaces, Tabs, and Panels
- Workspace: Your entire Zelos session, auto-saved continuously
- Tabs: Different views within a workspace (like browser tabs)
- Panels: Individual visualizations within a tab
Workspace
├── Tab 1: "System Overview"
│   ├── Plot Panel: CPU & Memory
│   ├── Table Panel: Current Values
│   └── Log Panel: System Events
└── Tab 2: "Detailed Analysis"
    ├── Plot Panel: All Sensors
    └── Plot Panel: Derived Metrics
Live Mode vs Trace Mode
| Aspect | Live Mode | Trace Mode |
|---|---|---|
| Data Source | Real-time stream | Recorded file |
| Time Range | Moving window | Fixed range |
| Playback | Play/pause current data | Navigate entire recording |
| Use Case | Active debugging | Post-mortem analysis |
Signal Organization
Signals follow a hierarchical structure with support for nested events:
Source (Device/Application)
└── Event (Logical Group, supports nesting)
    └── Field (Individual Value)
Example: robot/motors/left.rpm
- Source:
robot - Event:
motors/left(nested events) - Field:
rpm
Events can be nested to organize related data logically.
Account Management
Check Your Status
Open Settings (gear icon in the sidebar rail). Your team sits at the top of the settings sidebar and your account at the bottom. See Team and account.
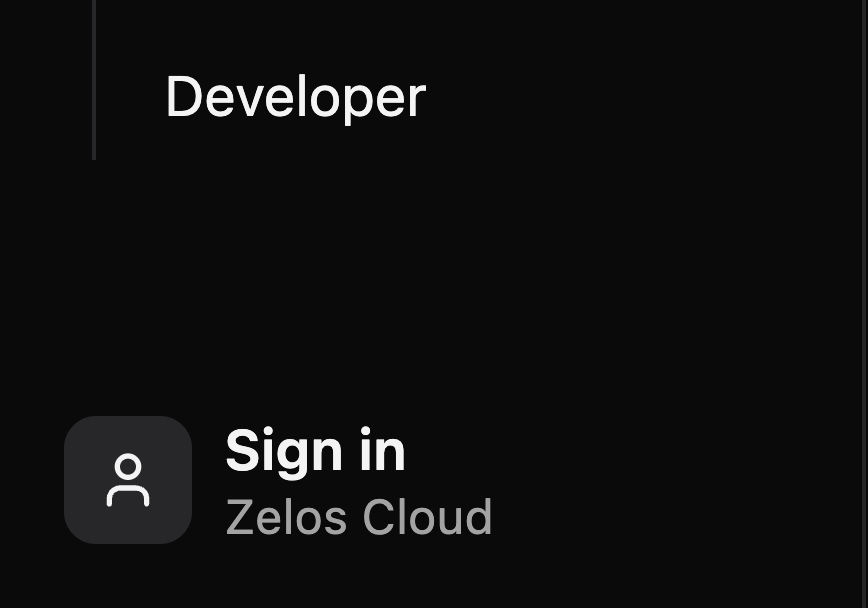
Once signed in, you can:
- Save and share layouts - Layouts sync to Zelos Cloud so your team can use them
- Access team layouts - Use layouts created by your team
- Upload traces and publish notebooks - Keep them in your organization's cloud storage and share them by link
- Carry your identity - Your account and team membership follow you to any machine you sign in on; local preferences (theme, panel defaults) stay with each installation
Sign Out
- Click Settings in the sidebar rail
- Click your account row at the bottom of the settings sidebar
- Pick Log out — it takes effect immediately
Local Work Preserved
Signing out doesn't delete local workspaces. Your work remains on your computer.
What's Next?
Now that you've created your first visualization, explore these key features:
-
Master tabs, modes, and workspace management
-
Discover all sidebar features and shortcuts
-
Explore Plot, Table, Value, Log, and Action panels
-
Open one launcher for tabs, timeline, settings, and more
-
Save and share panel arrangements with your team
-
Navigate time ranges and control playback
-
Use powerful glob patterns to find signals