Value Panel
The Value Panel highlights one signal in large text for quick inspection.
Overview
The displayed value follows timeline state:
- In live follow mode, the panel shows the latest value.
- In paused mode (live or trace), it shows the value at the timeline cursor.
- During playback, it updates as the cursor advances.
When there is no sample exactly at cursor time, the panel uses step-before lookup (latest sample at or before the cursor).
Using the Value Panel
Adding a Signal
To display a signal in a Value panel:
- Add a Value panel: Click Add Panel in the timeline toolbar, then select Value
- Drag a signal: Drop any signal from the tree onto the panel
- View updates: The panel updates from live/latest or cursor-time data depending on timeline state
Value Display Features
Enum Mapping
When signals have associated value tables (enums), the panel translates numeric values to readable labels.
Example mappings:
- Status code
0->"OK" - Mode value
3->"AUTO" - Error code
255->"CRITICAL_FAULT"
When available, mapped and raw values are shown together (for example: AUTO (3)).
Data Type Support
The Value panel handles all Zelos data types:
| Type | Display Example |
|---|---|
| Integer | 42 |
| Float | 3.14159 |
| String | "Active" |
| Boolean | true or false |
| Enum | RUNNING |
| Null | null |
Signal Chip
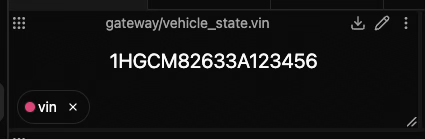
At the bottom of each Value panel, a signal chip provides:
- Signal name: Full path or shortened based on settings
- Scope context: Trace/agent labels when needed
- Data type: Shown on hover (int, float, string, etc.)
- Quick removal: X button to clear the panel
- Drag capability: Move signal to other panels
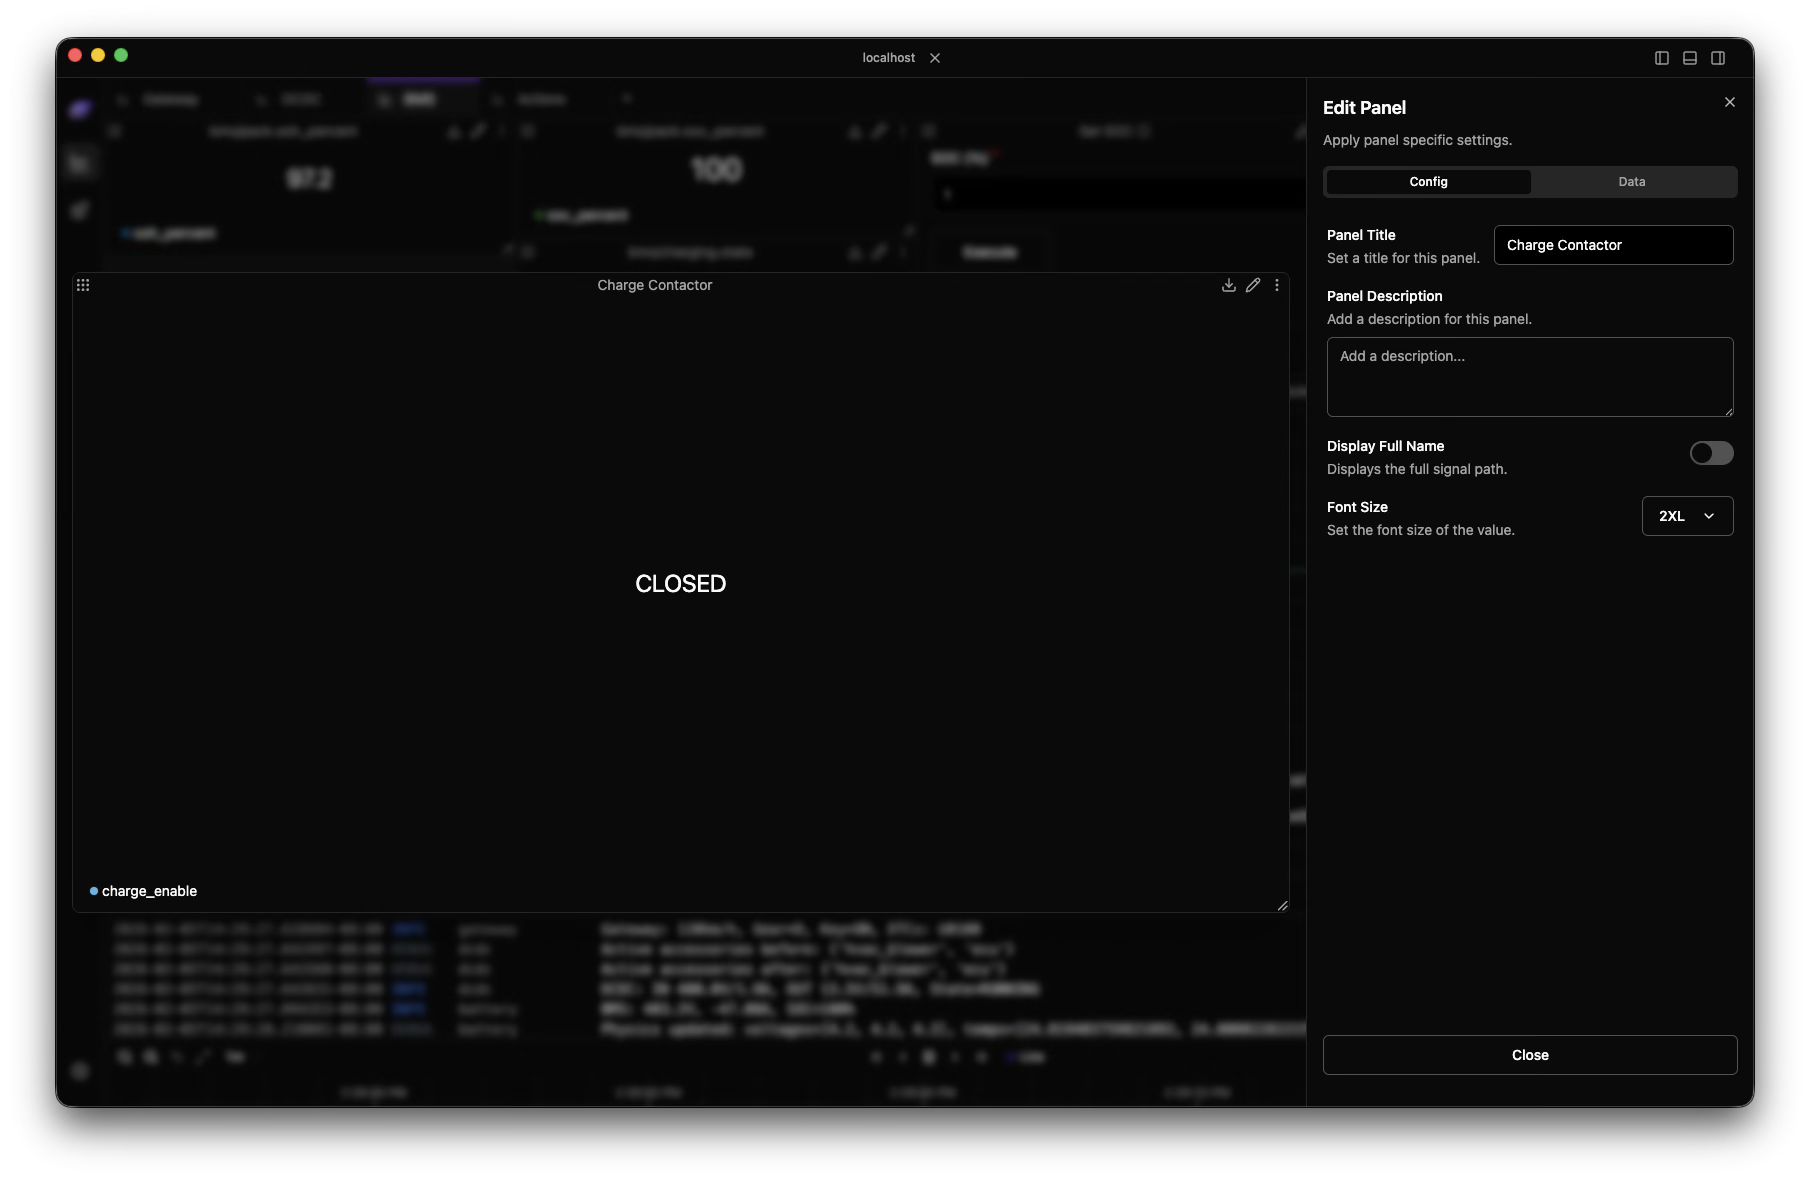
Panel Settings
Access settings through the panel menu (...) -> Edit Panel:
Display Options
Panel Title
Set a custom title. If empty, the panel uses the signal name.
Display Full Name
Toggle between:
- Full path:
robot/sensors.temperature - Short name:
temperature
Font Size
Choose from six text-size options.
Single Signal Display
Each Value panel displays one signal. To monitor multiple values:
- Create multiple Value panels
- Arrange them in a grid layout
- Save the arrangement as a reusable layout
Export Data
Value panels use the same export flow as other panel types:
- Click the panel menu (
...) - Select Export Data
- Choose CSV or JSON
- Export includes the selected timeline range for that signal
 View More
-
Explore other visualization options
-
View historical trends of your values
-
Monitor multiple values in a table
-
Save your Value panel arrangements
Pro Tip
Pair Value panels with Plot panels: Value for instant state, Plot for trend context.