Plot Panel
The Plot Panel visualizes your signal data as interactive time-series charts. It is designed for timeline-driven analysis with zooming, cursor control, and precise measurement tools.
Overview
The plot panel displays signals as line charts with time on the x-axis and signal values on the y-axis. Each signal gets its own color and can be toggled on/off individually. The panel supports real-time streaming data and historical analysis.
Basic Usage
Adding Signals
Drag and drop signals from the signal tree directly onto the plot panel. Each signal will appear as a colored line with a legend entry.
Navigation
- Left-drag to select a range and zoom into that time window
- Double-click to step back one view state (zoom/history reset behavior)
- Right-click to set the shared timeline cursor at the clicked timestamp
- Hover to inspect nearest signal values in the tooltip
Signal Management with Signal Chips
Below the plot, each signal is represented by an interactive signal chip that provides comprehensive signal management:
Color Management
- Color indicator - Colored circle showing the signal's current plot color
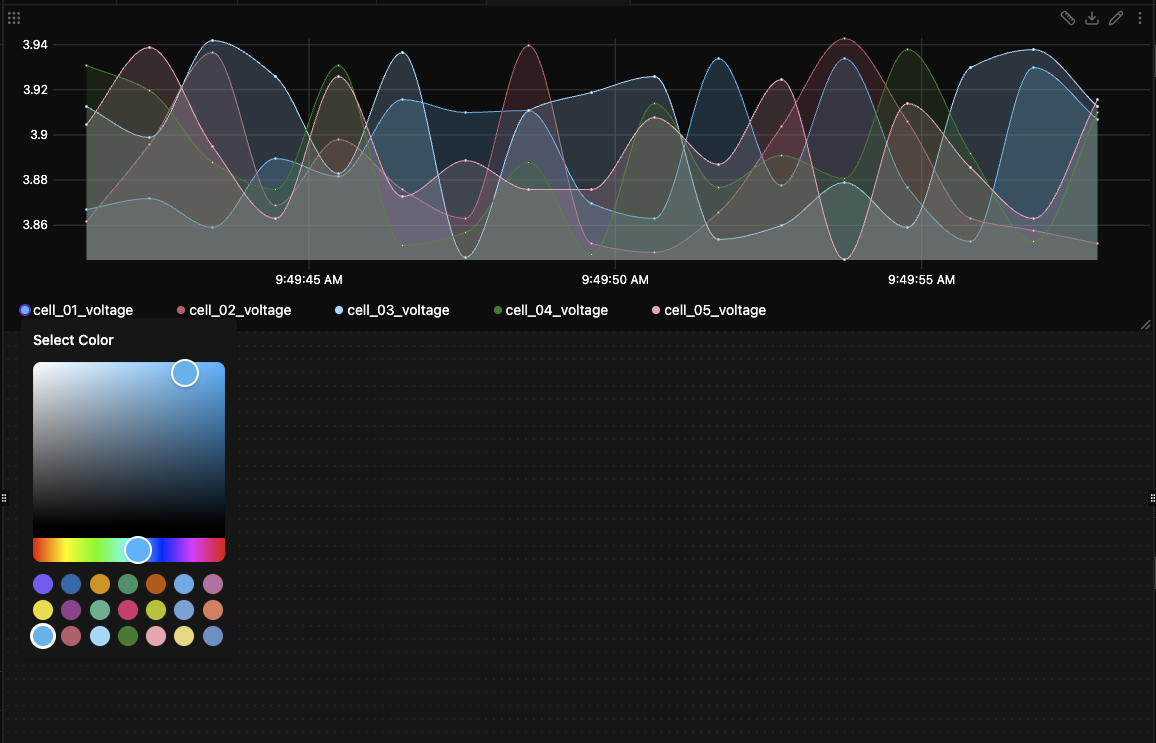
- Color picker - Click the color circle to open a color picker (see Color System below)
- Visual states - Solid circle when active, hollow circle when hidden
Signal Control
- Toggle visibility - Click anywhere on the chip to show/hide the signal line
- Remove signal - Click the X button to remove from the panel entirely
- Drag to other panels - Drag chips between panels to reorganize your data
Information Display
- Signal name - Shows full path or shortened name based on panel settings
- Data type - Hover to see signal data type in tooltip
- Status indicator - Grayed out when no data available for current time range
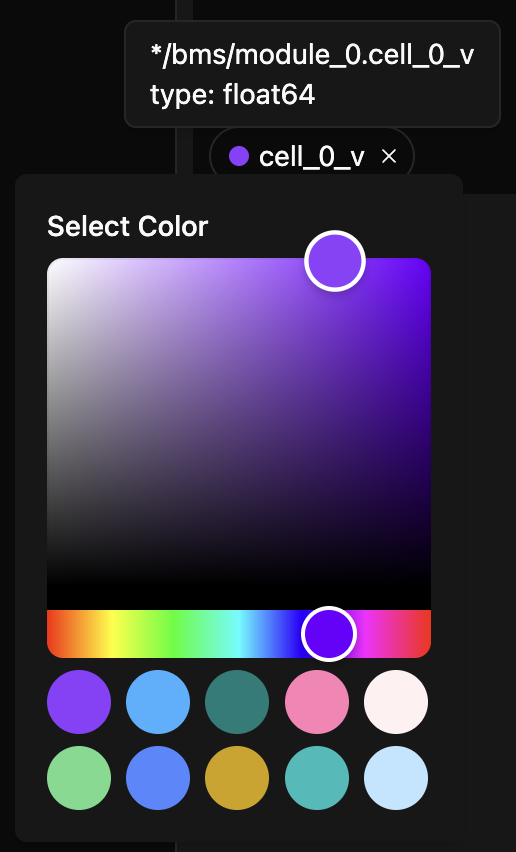
Color System
Click the color circle on any signal chip to open the color picker:
- Visual color selector - Interactive gradient picker for precise color selection
- Quick palette - 20+ pre-selected CVD-safe colors for fast selection
- Real-time preview - Colors update smoothly while dragging in the selector
Multi-Trace Plotting
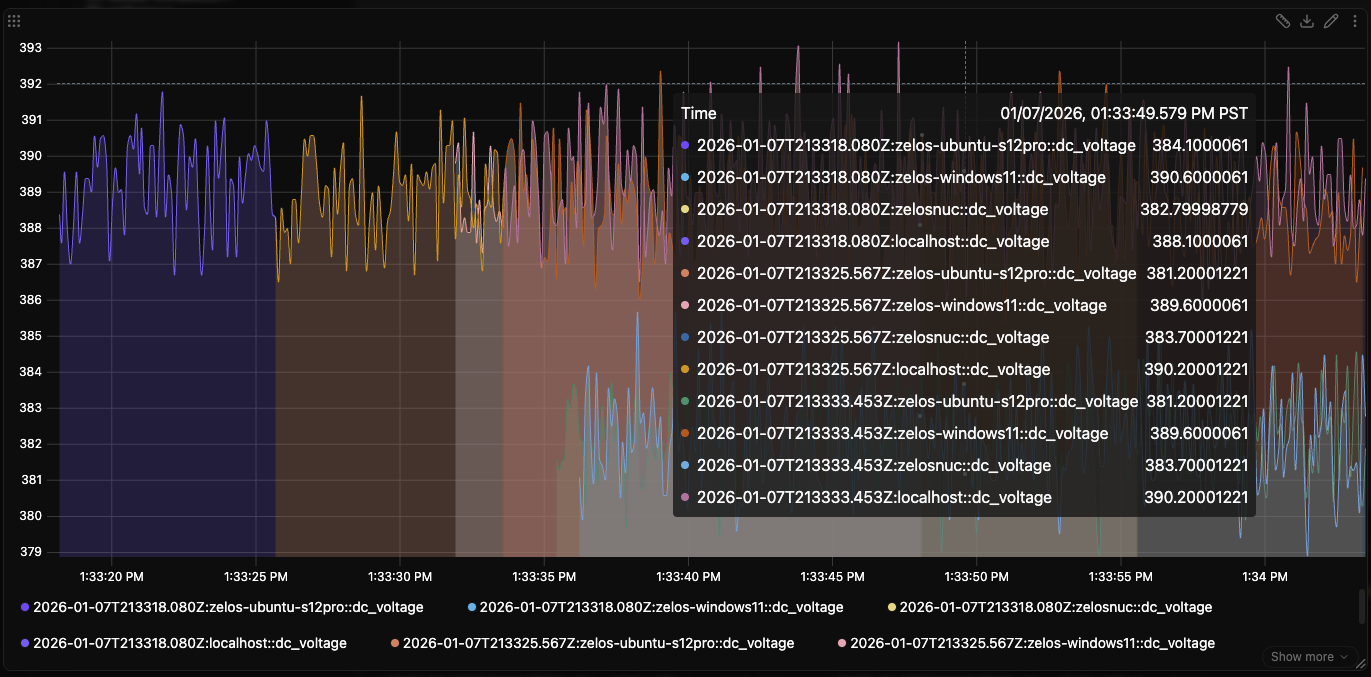
The plot panel supports viewing signals from multiple traces simultaneously, enabling powerful comparison and analysis workflows.
Viewing Multiple Traces
Add signals from different traces to the same plot panel to compare data across recordings:
- Trace identification - Each signal shows its source trace in the legend for clear identification
- Agent labels - Signals display both trace and agent information when needed
Timeline Cursor Integration
The plot panel is fully synchronized with the global timeline cursor used by table, value, and log panels.
Right-Click to Jump Cursor
Right-click anywhere in the plot area to jump the shared timeline cursor to that timestamp.
- In paused mode, this updates cursor time in-place.
- In live mode, this action transitions to paused view and sets the cursor to your clicked time.
- All other timeline-aware panels immediately sync to the new cursor position.
Dragging the Plot Cursor
When paused (and playback is not running), the plot renders a draggable cursor handle:
- Drag horizontally to scrub exact cursor time directly from the plot
- Cursor movement updates the global timeline cursor in real time
- Handle is hidden while playback is actively running
Cursor Lookup and Tooltip Behavior
The cursor lookup uses left-closest behavior:
- Tooltip values resolve to the closest sample at or before the hovered time
- If a hovered point is null, lookup backtracks to the nearest earlier non-null sample
- This avoids misleading forward jumps when data is sparse or gapped
Zoom and View History
Zoom and reset behavior in the plot panel is stateful and mode-aware:
- Drag-selecting a time range commits a zoom step
- Double-click steps back through zoom/view history
- If no history remains:
- live workspaces return to live follow
- trace/paused workspaces return to the initial paused view window
- Starting a new drag-select while playback is running stops playback first
Measurement Tool
The measurement tool allows you to make precise measurements between two points on your signals. This is particularly useful for analyzing signal deltas, timing relationships, and precise value changes.
Activating Measurements
- Pause the view - The measurement tool is only available when not in live mode
- Click the ruler icon in the panel header to enable measurement mode
- Click on the plot to place your first cursor
- Click again to place your second cursor
- A measurement popup appears showing detailed results
Pause Required
The measurement tool is only available in paused mode. If you try to activate it while in live mode, you'll see a tooltip indicating you need to pause first.
Using Measurement Cursors
Once enabled, the measurement tool provides interactive cursors:
Cursor Placement
- Click anywhere on the plot to place cursors
- Cursors snap to the nearest data point for precision
- Cursor 1 (blue) and Cursor 2 (green) can be placed in any order
Moving Cursors
- Drag the cursor lines to reposition them
- Drag the numbered labels for easier cursor manipulation
- Cursors snap to data points and move freely — if you drag one past the other, they automatically swap so Cursor 1 is always the earlier time
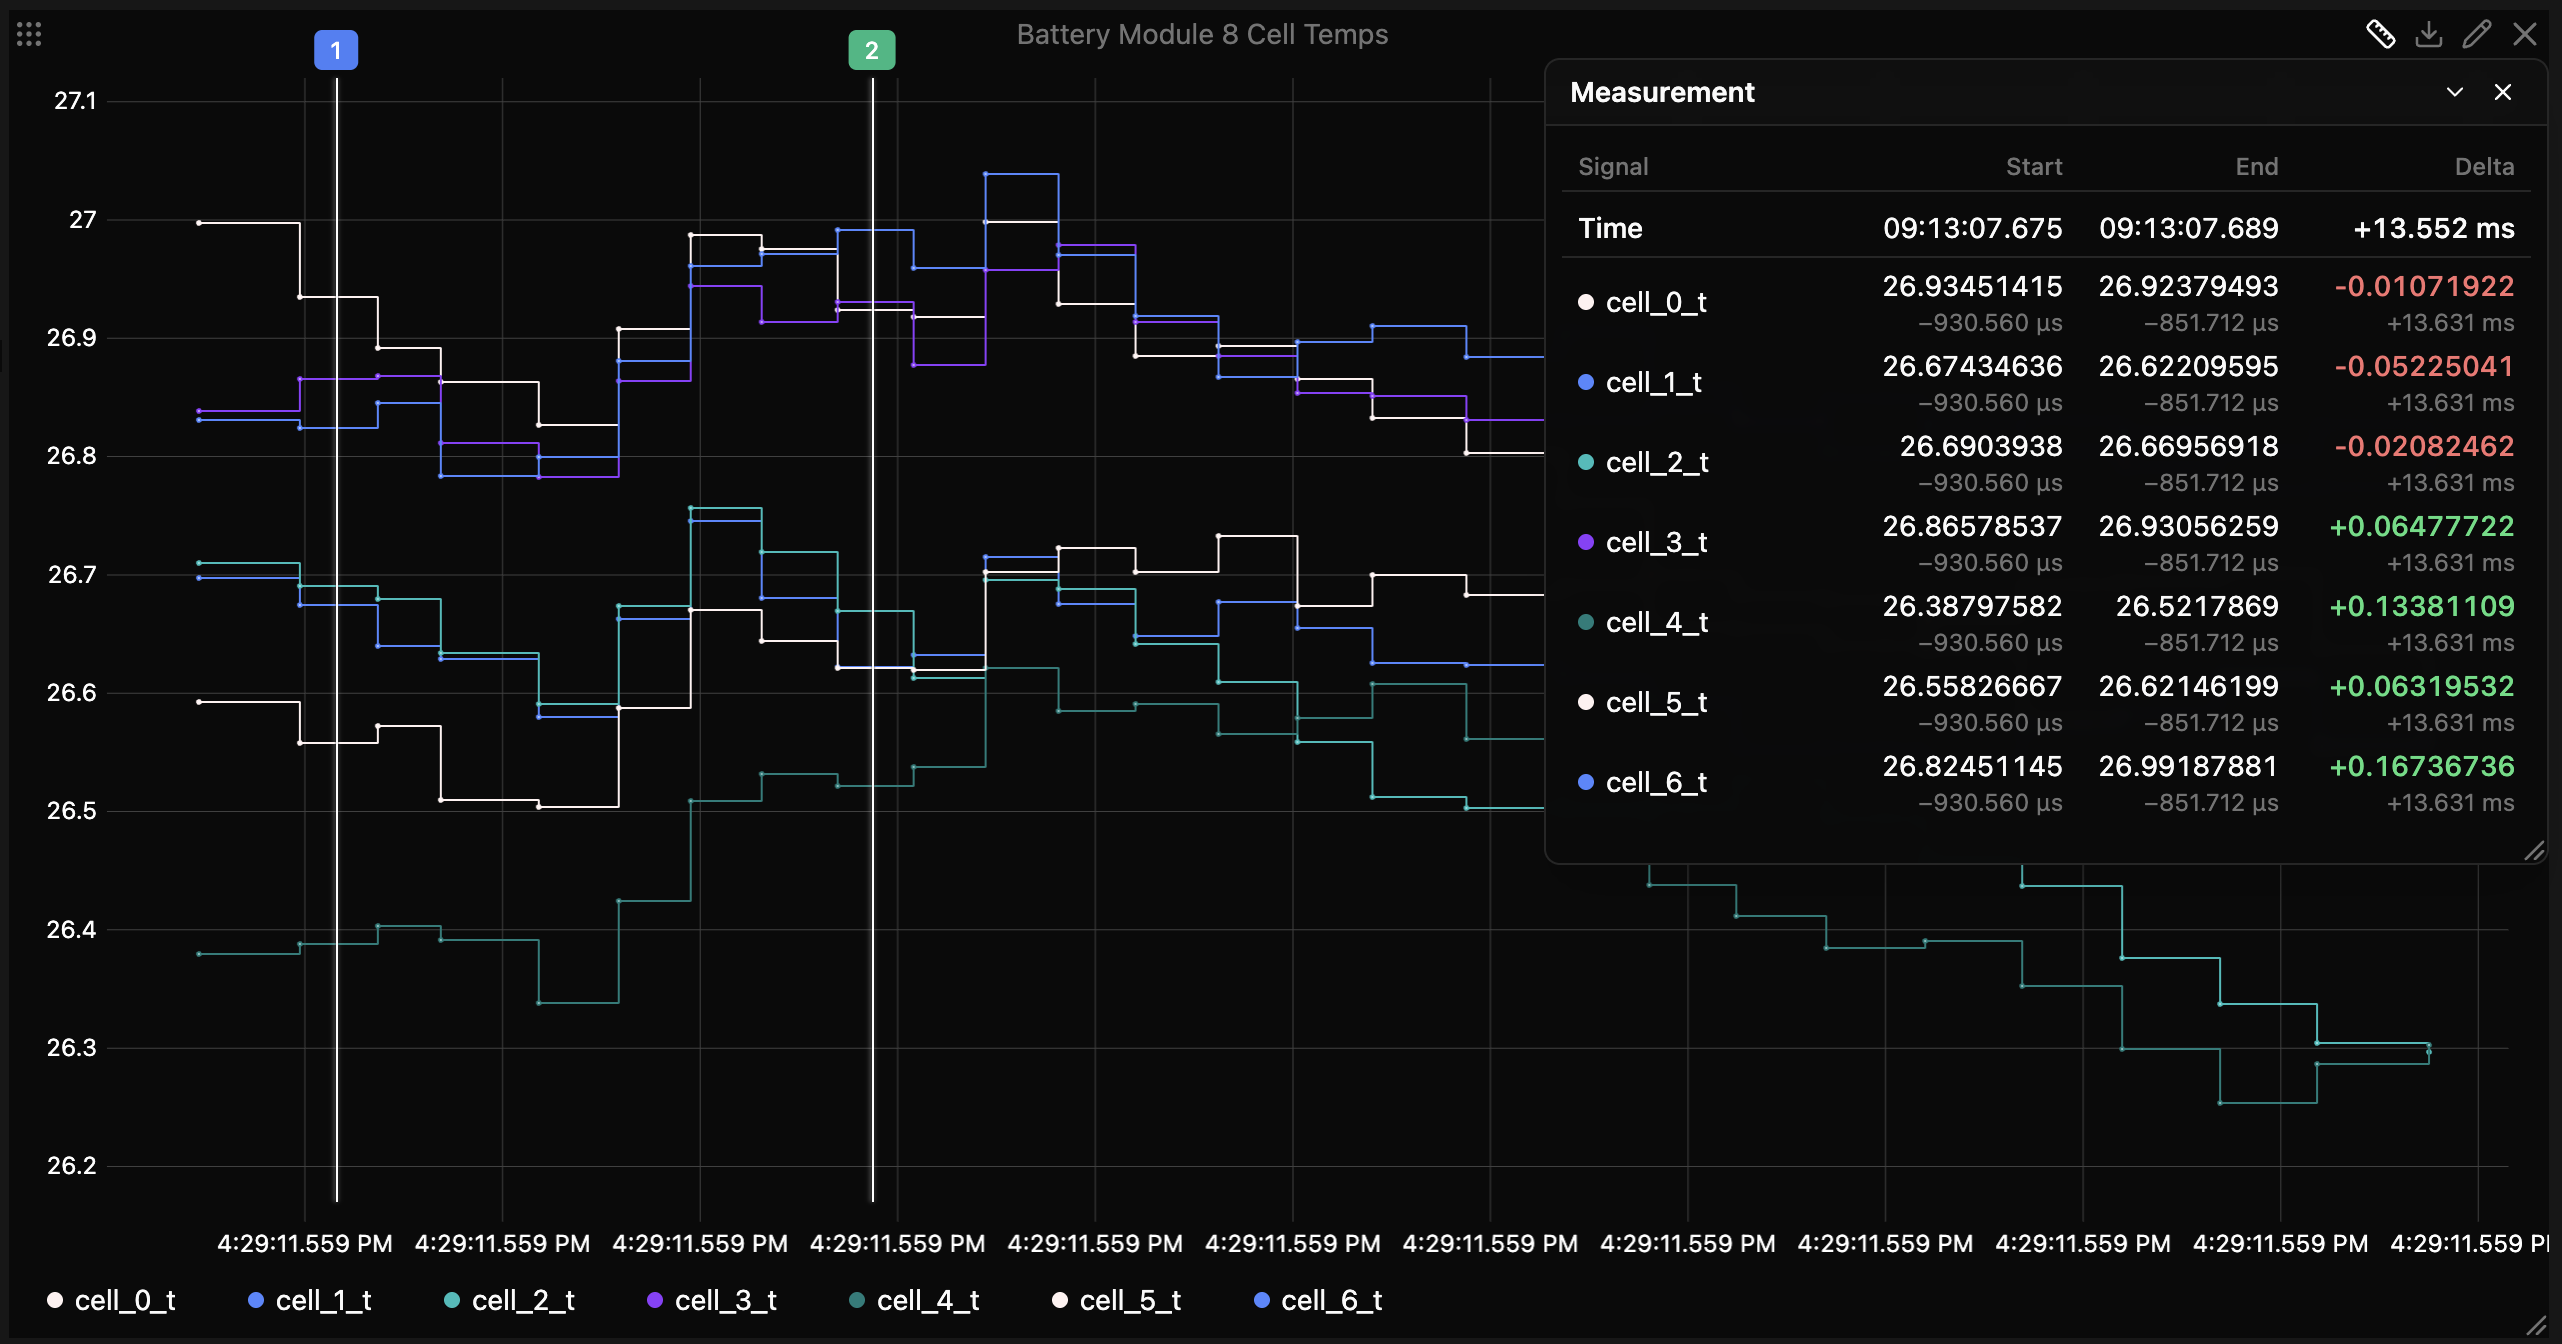
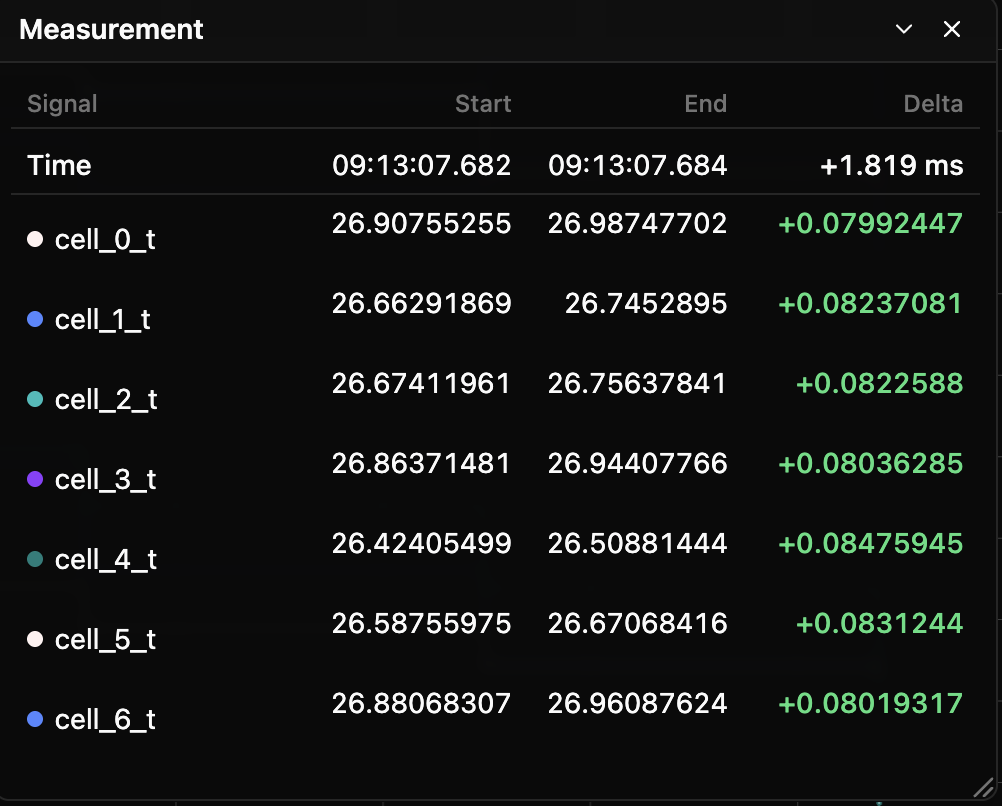
Measurement Results
The measurement popup displays comprehensive results for all visible signals:
Time Information
- Start Time - Timestamp of cursor 1 position
- End Time - Timestamp of cursor 2 position
- Delta - Time difference between cursors
Signal Measurements
For each visible signal, you'll see:
- Start Value - Signal value at cursor 1 position
- End Value - Signal value at cursor 2 position
- Delta - Value difference (End - Start)
Visible Signals Only
Measurements only include signals that are currently visible (not hidden via signal chips). Hidden signals won't appear in the measurement results.
Time Offset Indicators: When signal data points don't align exactly with cursor positions, small time offset indicators show the actual data timestamps. This ensures you know exactly which data points are being measured.
Managing the Results Popup
The measurement results popup is fully interactive:
You can:
- Drag the header to reposition anywhere on the panel
- Drag the resize handle (bottom-right corner) to adjust size
- Click the chevron to collapse/expand the popup
- Click the X button to clear both cursors and close the popup
Measurement Data Formats
Time Formatting
- Clock format (HH:MM:SS.mmm) for start/end times
- Delta format (+/-X.XXX s/ms/µs/ns) for time differences
- Automatic unit selection based on magnitude
Value Formatting
- Integer values displayed without decimals
- Decimal values limited to 8 decimal places
- Scientific notation preserved when present
- Enum values show both text and numeric representations
Precision
- All timestamps stored and calculated in nanosecond precision
- Values use the original signal precision
- Delta calculations account for actual data point timestamps
Plot Panel Settings
Access panel settings through the edit panel dialog:
Display Options
Panel Title: Set a custom title for the panel. Leave empty to use the default display.
Display Full Name:
Toggle between showing full signal paths (source/event.field) or shortened names (field).
Y-Axis Range
Control the Y-axis scale to focus on specific value ranges. Access these settings by clicking the edit button in the panel header.
By default, plots auto-scale to show all data. You can override this by setting min/max values:
| Min | Max | Behavior |
|---|---|---|
| Empty | Empty | Auto-scale to fit all data (default) |
0 |
Empty | Fixed bottom at 0, auto-scale top |
| Empty | 100 |
Auto-scale bottom, fixed top at 100 |
0 |
100 |
Fixed range from 0 to 100 |
Common Use Cases:
- Show zero baseline - Set Min=
0, leave Max empty - Logic level monitoring - Set Min=
0, Max=3.3for 3.3V signals - Zoom to range - Set both to focus on a specific value range
- Compare plots - Use identical ranges across multiple panels
Tip
Leave both fields empty to return to auto-scaling.
Tips
Measurement Accuracy
- Zoom in closer to your area of interest before placing cursors
- Use the snap-to-data-point feature for maximum precision
- Check time offset indicators when exact timing matters
- Hide irrelevant signals to focus measurements on signals of interest
Export Data
The plot panel supports exporting data in multiple formats:
- CSV - Tabular format with timestamps and signal values
- JSON - Structured format with metadata and arrays
Exported data respects the current time range and includes all visible signals. Measurement cursors do not affect export scope - the full visible time range is always exported.
Interaction Controls
- Left-drag - Select a range and zoom
- Double-click - Step back through zoom/view history
- Right-click - Set shared timeline cursor to clicked time
- Cursor handle drag (paused) - Scrub timeline cursor directly in the plot
Data Availability
Measurement accuracy depends on data resolution. Sparse data may result in measurements between data points rather than at exact cursor positions. Time offset indicators help identify these situations.