Panels
Panels are the core visualization components in Zelos. They display your data in various formats, from time-series plots to tables, logs, and focused value readouts. Each panel type is optimized for specific use cases.
Panel Types
| Type | Purpose |
|---|---|
| Plot | Time-series data |
| Table | Cursor-aware signal values |
| Log | Text log events |
| Value | Large signal readouts in a compact grid |
| Action | System control |
Panel Management
Adding Panels
Create new panels to visualize your data:
- Click "Add Panel" in the timeline toolbar
- Select the desired panel type
- Panel appears in the workspace
Panel Layout
Panels automatically arrange themselves in a responsive grid system.
Grid Features
- Automatic arrangement - Panels position themselves optimally
- Drag to reorder - Click and drag panel headers
- Resize panels - Drag edges or corners
- Maximize - Double-click header to expand
Panel Controls
Each panel includes standard controls in its header:
| Control | Function | Action |
|---|---|---|
| Title Bar | Panel identifier and move handle | Drag to move |
| Settings | Configure panel | Click pencil icon |
| Menu | Additional options | Click ⋮ for menu |
| Close | Remove panel | Click × to delete |
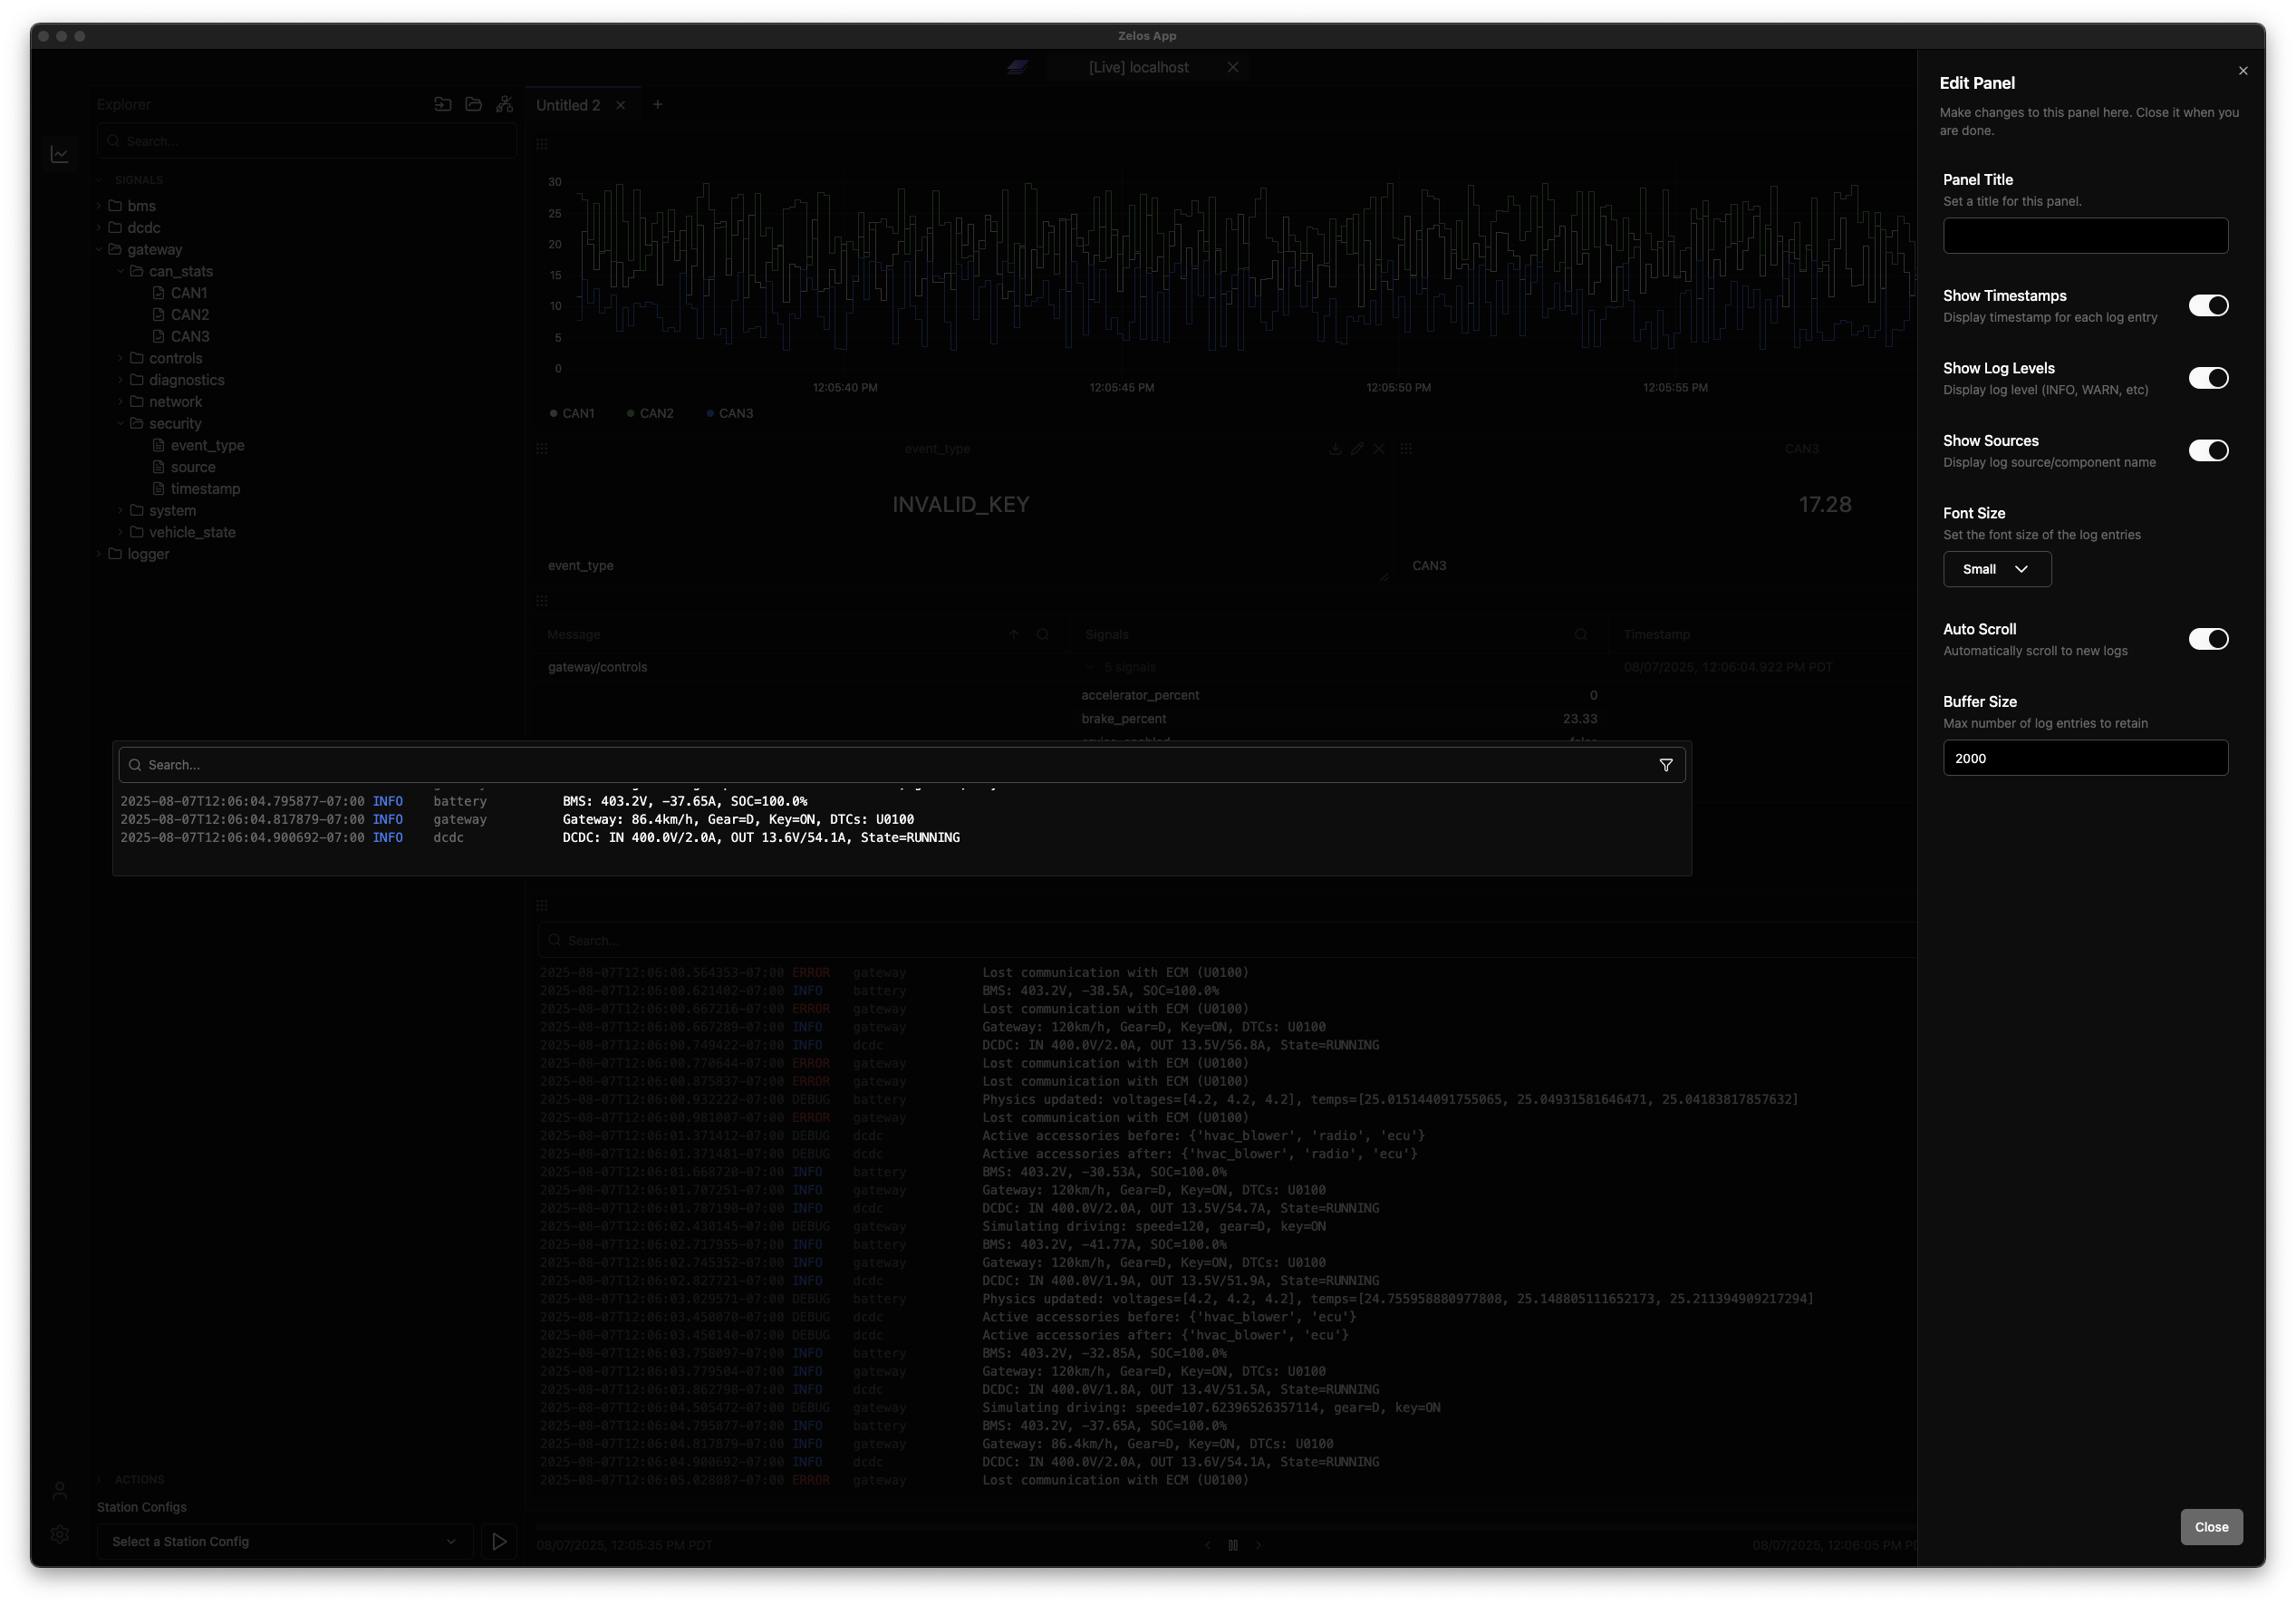
Panel Descriptions
Add custom descriptions to panels to explain their purpose or provide context:
- Open panel settings (click pencil icon)
- Enter a description in the Description field
- Description appears in the info icon of the panel title
Benefits:
- Team collaboration - Explain what the panel monitors and why
- Layout sharing - Descriptions are saved with layouts
- Action panels - Descriptions are auto-populated from the action schema
Best Practice
Add descriptions when sharing layouts with your team to help others understand the purpose of each panel.
In addition, panels contain settings that are unique to the panel type. For example:
Cross-Tab Panel Movement
Move panels between tabs to organize your workspace:
- Drag panel header to lift the panel
- Move to another tab in the tab bar
- Release to drop the panel in the new tab
Visual Feedback:
- Drop zones highlight when hovering over valid targets
- Overlay follows your mouse pointer for precise placement
- Invalid drop targets are clearly indicated
Workspace Organization
Cross-tab panel movement allows you to reorganize complex workspaces without recreating panels or losing their configurations.
Adding Data to Panels
Multiple ways to populate panels with signals:
Drag and Drop
The primary method for adding signals:
- Locate signal in the sidebar tree
- Drag signal to target panel or empty space
- Release to add
Double-Click
- Double-click any signal in the tree
- Automatically creates appropriate panel type
Dragging
You can drag at any layer of the tree. Dragging an event adds all its fields, dragging a source adds all events and fields.
Signal Chips
Signal chips provide quick access to signal management within panels:
Chip Features
| Feature | Description |
|---|---|
| Drag between panels | Move signals from one panel to another |
| Drag to tabs | Create new tabs by dragging signals to the tab bar |
| Color picker | Click the color indicator to quickly change signal colors |
| Toggle | Click the chip to hide the series on a plot panel |
| Scrollable list | Shows 2 rows by default, scroll to see more signals |
Moving Signals
- Between panels - Drag a signal chip from one panel to another
- To new tab - Drag a signal chip to the "+" tab button to create a new tab with that signal
- An existing tab - Drag chips within a tab to launch on a new panel
Quick Color Changes
Click directly on a signal's color indicator in the chip to open the color picker without entering panel settings.
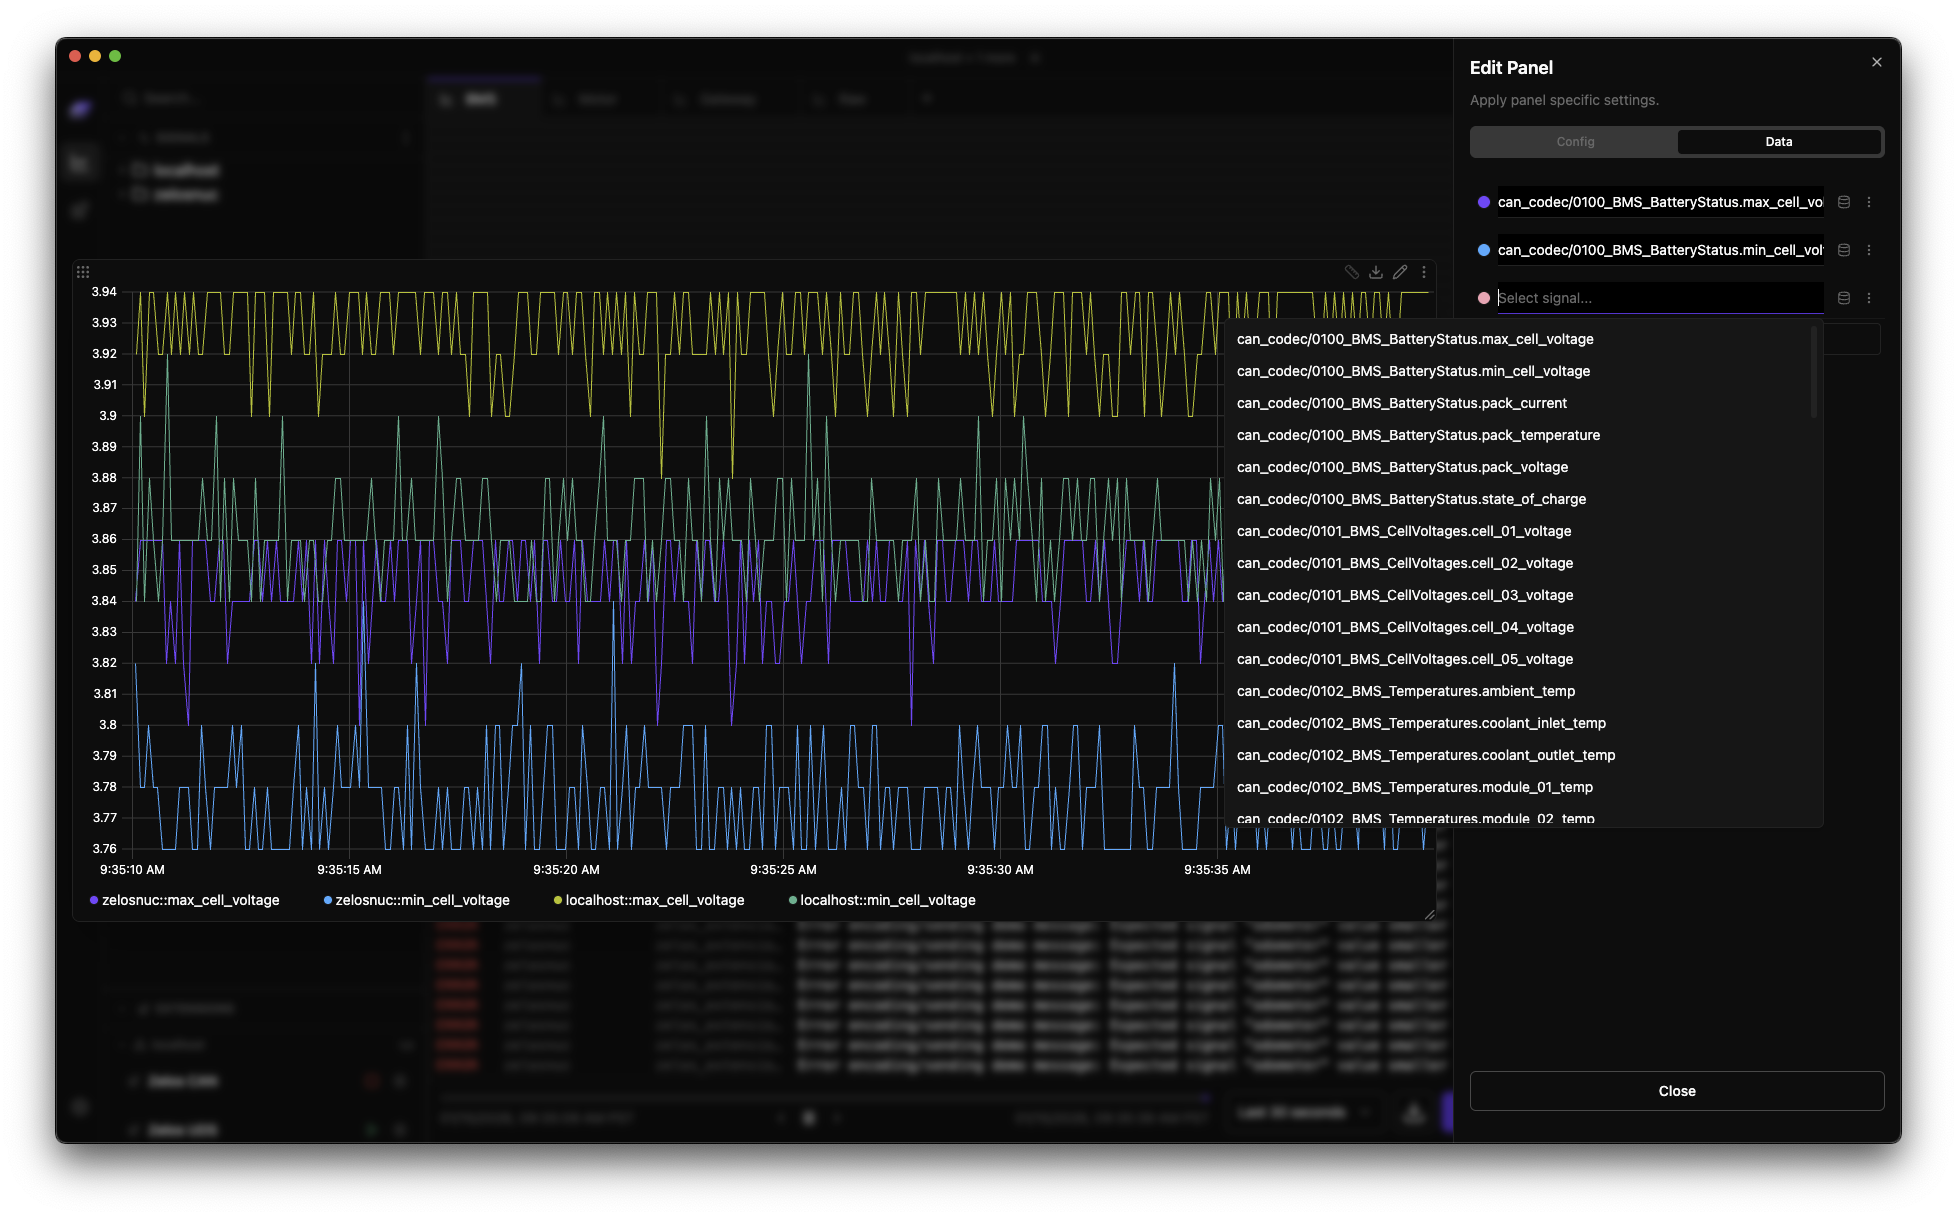
Query Builder
The Query Builder in panel settings provides advanced signal configuration:
Signal Configuration
Access the Query Builder from Panel Settings > Data tab:
| Feature | Description |
|---|---|
| Signal path autocomplete | Type to search and select signals |
| Scope selector | Bind signals to specific agents or traces |
| Color picking | Colors can be picked when editing signals |
Using the Query Builder
- Open panel settings (pencil icon)
- Navigate to the Data tab
- Add or edit signals using the signal path field
- Use autocomplete to find available signals
- Set scope to filter by agent or trace if needed
Signal Scope
Use the scope selector to bind a signal to a specific agent or trace when working with multi-agent workspaces.
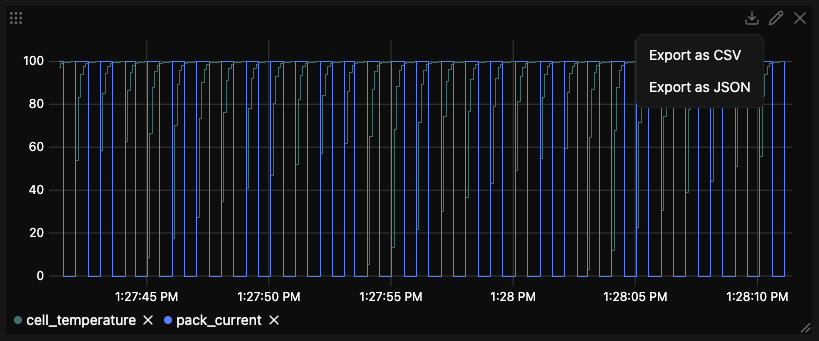
Panel Export Feature
Export panel data for external analysis or sharing.
Export Methods
Access export from any panel:
- Click the ⋮ menu in panel header
- Select "Export Data"
- Choose format
- File downloads automatically
Export Formats
CSV Format
Best for spreadsheet analysis:
timestamp,source/event.field1,source/event.field2
1746210309.190321,24.5,1200
1746210309.190324,24.6,1201
1746210309.191392,24.7,1202
Features: - First row contains headers (timestamp + signal names) - Timestamps in Unix format (seconds since epoch) - Empty cells for missing data points - Compatible with Excel, Google Sheets, pandas
Empty Cells
Empty cells indicate no data was recorded for that signal at that timestamp.
JSON Format
Best for programmatic processing:
{
  "metadata": {
    "panel": {
      "id": "panel-uuid",
      "title": "Panel Name",
      "type": "PLOT"
    },
    "timeRange": {
      "start": "2024-01-15T10:30:00.000000Z",
      "end": "2024-01-15T10:35:00.000000Z"
    },
    "signals": ["signal1", "signal2"],
    "exportedAt": "2024-01-15T10:36:00.000Z"
  },
  "data": {
    "timestamps": [1746210309.190321],
    "values": {
      "signal1": [24.5],
      "signal2": [1200]
    }
  }
}
Features: - Complete metadata (panel info, time range, signals) - Preserves data types and structure - Easy to parse programmatically - Includes export timestamp
Text Format (Logs Only)
For log panels:
2024-01-15T10:30:00.123456Z [INFO] system: Application started
2024-01-15T10:30:01.456789Z [WARN] sensor: Temperature above threshold
2024-01-15T10:30:02.789012Z [ERROR] motor: Communication timeout
What Gets Exported
- Time Range - Current timeline selection
- Signals - All signals configured in the panel
- Precision - Full precision values (no rounding)
For large ranges, exports are chunked automatically behind the scenes to keep memory usage stable.
Unfiltered Data
Export always includes the full raw data for every signal in the panel. Panel-level filters (e.g. log severity or search) are not applied to exports.
File Naming
Files are automatically named with the pattern:
Times use local time inYYYY-MM-DD_HH-MM-SS format.
Working with Exported Data
Python
CSV:
import pandas as pd

df = pd.read_csv("zelos_Motor_Temps_2024-01-15_10-30-00_to_2024-01-15_10-35-00.csv")

# Timestamps are epoch seconds — convert to datetime for time-based ops
df["timestamp"] = pd.to_datetime(df["timestamp"], unit="s")
JSON:
import json, pandas as pd

with open("zelos_Motor_Temps_2024-01-15_10-30-00_to_2024-01-15_10-35-00.json") as f:
    export = json.load(f)

# Metadata is available at export["metadata"]
df = pd.DataFrame({
    "timestamp": pd.to_datetime(export["data"]["timestamps"], unit="s"),
    **export["data"]["values"],
})
Timestamp Format
CSV and JSON timestamps are epoch seconds (e.g. 1746210309.190321). Use pd.to_datetime(ts, unit="s") in pandas or datetime.fromtimestamp(ts) in plain Python.
Panel-Specific Features
Plot Panel
- Time-series visualization
- Precision measurement tool with delta calculations
- Cursor-integrated zoom/selection with history step-back
- Right-click to set the global timeline cursor
- Signal management and color customization
Table Panel
- Live latest values in follow mode
- Cursor-time values in paused/trace playback
- Fast filtering and sorting
Log Panel
- Real-time log streaming
- Multi-level filtering by severity, agent, and source
- ANSI color support for terminal formatting
- Advanced search with glob patterns and highlighting
- Right-click rows to jump the global timeline cursor
Value Panel
- One or more large signal readouts in a configurable grid
- Live latest in follow mode, cursor-time in paused/trace mode
- Value-table (enum) label mapping support
Next Steps
-
Time-series visualization
-
Cursor-aware value monitoring
-
Event analysis
-
Navigate your data